September was a bearish month for the market and October has witnessed some of the biggest crashes and corrections in history. While most market pundits believe the trend remains strong for the market, it’s important to note all the 50-day major moving averages failed to hold to end the quarter.

With the third-quarter earnings season just around the corner, and higher volatility in recent weeks, overall market volatility could heighten if earnings expectations aren’t met. Sentiment for the moment seems hesitant and why the volatility index (VIX) tested a four-month high in September.
The chart below shows the VIX testing a high of 28.79 last month, with the May peak at 28.93. This occurred as the major indexes suffered a minor selloff with the action forming a “double-top,” and the major indexes rebounding for four-straight days afterwards.
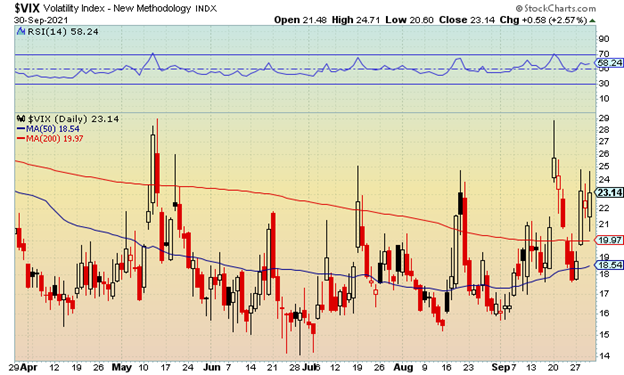
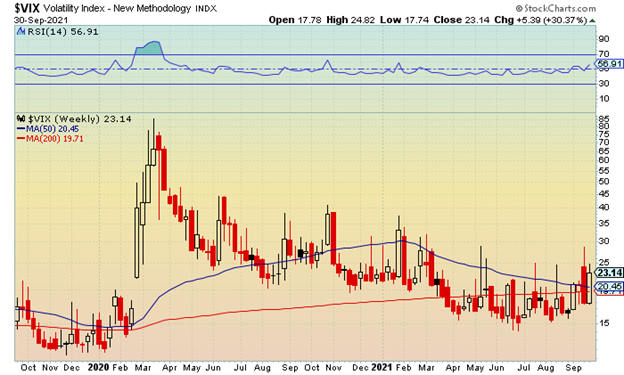
The VIX is a very short-term indicator that rises during bear markets and falls during bull markets. Historically, the VIX has traded around the 20 level but it spiked to 85 in March 2020 during the start of the coronavirus pandemic. When the market was trading at previous all-time highs to start 2020, the VIX was trading in the low teens and briefly in the single digits.
One thing that has been fascinating is that the VIX has not closed below 15 since February 2020. Although this level was breached during the summer months, the bulls were unable to hold 15 into the closing bell despite all-time highs still being made.
The index also went through a period of trading between 15-20 from late May through August, with just a handful of closes above 20. Up until September, this level had also been breached before a quick recovery within a day or two. However, in September, the VIX closed above 20 in eight sessions.
As October begins, it will be important for the bulls to get the VIX back below 20 and the 200-day moving average for some of the anxiety to come out of the market. More importantly, if all-times highs are to return into year end, the VIX will need to recover its 50-day moving average.
On the flip side, if the VIX closes above 29-30, there could be panic selling that pushes the index higher. The current 52-week peak is at 41.16 which was triggered in October 2020.
For traders looking for action, one of the best ways to trade volatility is by using the iPath S&P 500 VIX Short-Term Futures (VXX). The recent 52-week low reached 24.37 with the one-year peak north of 111.
The chart shows the September high hitting 32.41, with the current price action hovering just above the 50-day moving average. It will be important the VXX holds 30-32 during the Q3 earnings season. If not, it would also confirm a market pullback, or correction, with risk towards 37 and the July high.
The VXX November 35 calls currently trade at $2.75 and can be used by traders that believe a possible trip towards 40 could be on the horizon. If the VXX trades above 40.50, technically, by November 19th, these call options would be worth $5.50, or a double from current levels. The breakeven point is at 37.75, with losses occurring if this level holds.
If Q3 earnings start to come in better than expected, and the market rebounds from its September losses, traders can target the VXX November 26 puts, which are currently trading near the $3 level. It is important to note, however, VXX will need to trade below 23, by November 19th, just for this trade to break even.
If the VXX were to trade towards 20, and fresh 52-week lows, these puts would also double at they would be $6 “in the money.”. If the VXX fails to breach 23, loses would occur with a total loss of premium if the VXX remains above 26 by November 19.