Stock market volatility is arguably one of the most misunderstood concepts in investing but can be an extremely important technical tool when it is used to analyze the stock market. To start, volatility is often referred to as the fear gauge, and the range of price change the stock market can experience over a given period of time.

If the price stays relatively stable, the stock market has low volatility. A highly volatile stock market can reach new highs and retreat quickly, moves erratically, and also has dramatic falls before spiking again.
Most investors tend to experience the pain of loss more acutely than the happiness of a gain, so a volatile stock market that moves up as often as it goes down may still seem like an unnecessarily risky proposition.
However, what seasoned traders know that the average investor may not is that stock market volatility actually provides numerous money-making opportunities for the patient and astute investor. Investing is all about risk and reward and it works both ways. Each trade carries risk both of failure and of success. Without volatility, there is a lower risk of either.
There are a number of ways to measure volatility such as ETF (exchange-traded-funds) and ETN’s (exchange-traded-notes). The one I follow and is the most popular is the CBOE Volatility Index (VIX) which historically trades around the 20 level.
The VIX had traded within the 20-25 range since mid-November, with only one close above the 25 level to finish out 2020. That occurred on December 21st with the intraday peak tagging 31.46. However, the VIX started of 2021 with three-straight closes above the 25 level and 50-day moving average with the first trading day of the New Year tapping and intraday high of 29.19.
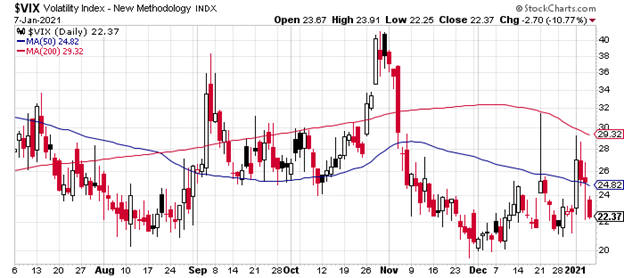
Historically, volatility trades around the 20 level but when all-time highs are being made, the VIX typically trades in the low teens and sometimes into the single-digits. With the political races finally resolved, the fourth-quarter earnings season will be the focus on how the stock market could play out for the rest of the month and into February.
While the 25 level has been stretched to the upside, the more important levels to watch for a possible near-term top in the stock market is the 30 area and the 200-day moving average. Consecutive closes above these levels would likely indicate upcoming market weakness.
On the flip side, volatility has not closed below the 20 level since February 21st despite the major indexes testing fresh all-time highs throughout November, December and into the first week of January.
If the fourth-quarter earnings season can produce solid results above Wall Street’s expectations, along with a bright outlook for 2021, then multiple closes below the 20 level would likely signal a continued run towards fresh all-time highs for the major indexes. If there are a number of earnings misses or lower outlooks, with the VIX closing above the 30 level on multiple sessions, a pullback in the major indexes could be forthcoming.