
2026 got off to a great start for the Velocity Report portfolio. My portfolio tracking spreadsheet shows a total return of 10.6%, and my personal Velocity Report brokerage account increased by 10.5% for the quarter.
In contrast, the chart below shows that the tracking ETFs for the S&P 500 and Nasdaq 100 indexes posted negative returns for the quarter:
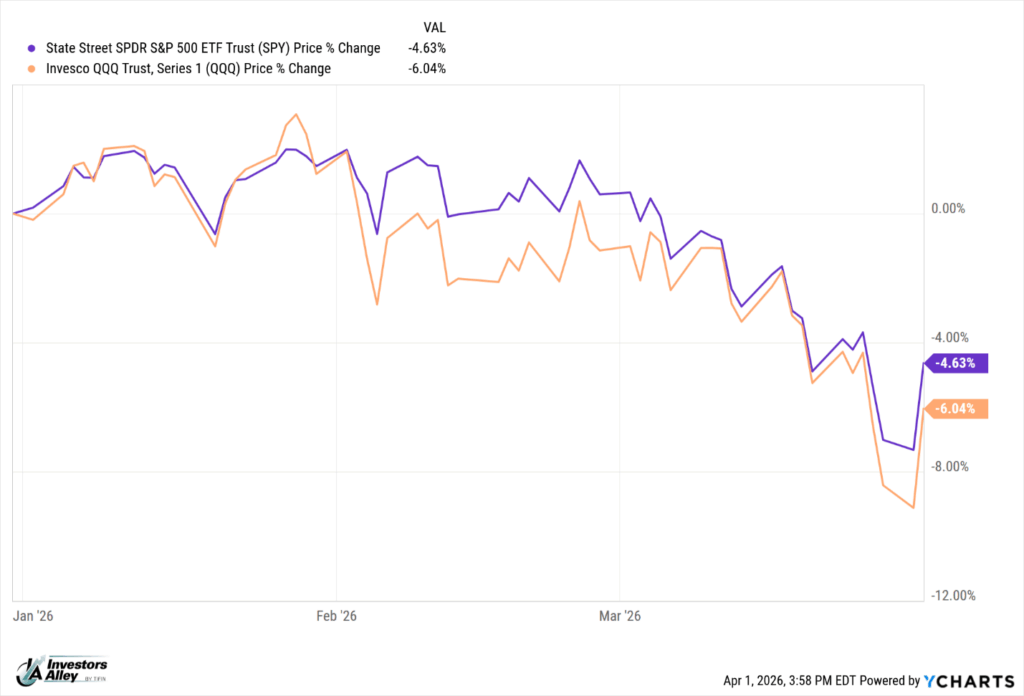
The Velocity Report outperformance came from great gains in our energy stocks, including Marathon Petroleum Corp (MPC), up 50%; Kodiak Gas Services (KGS), up 57%; and Liberty Energy (LBRT), up 60%. Subscribers who watched my presentation in late February will recognize these names. I knew they’d do well, but didn’t expect it to be this quick. I hope you picked up a few shares.
I recommended a mid-quarter position trim for LBRT to lock in some gains. The end-of-quarter rebalancing also led to selling shares of these stocks for the same reason.
On March 19, I recommended selling Blue Owl Capital Inc. (OWL) to prevent further losses. At that time, OWL was down 23% for the quarter. As I write this on April 1, OWL is down 42% year to date.
With the quarterly rebalancing at the end of March, Barrick Mining (B) was added to the portfolio to give us more metals and mining exposure. There is a write-up of Barrick in this issue of the newsletter. If you haven’t rebalanced your portfolio yet, click here to access the free tool.
Looking ahead, with the major stock indices down this year to date for several reasons—including the war against Iran—there is strong potential for stocks in general to turn higher for the rest of the year.
Got a question for me? Submit it here to include in the monthly video mailbag. The most recent update was posted yesterday. You can watch it here. The schedule for the rest of the year is 05/13/26, 06/10/26, 07/08/26, 08/12/26, 09/09/26, 10/14/26, 11/11/26, and 12/09/26, subject to change.
Are you new to The Velocity Report and wondering where to start? Then check out the Start Out Portfolio with three of my top recommendations for new subscribers.
New! In case you missed it, we’ve added text (SMS) alerts to The Velocity Report. We’re not doing high volume trading so don’t expect me to blow up your phone. Rather, it’s another tool we have to get you timely buy and sell alerts and anything else important to your newsletter experience. Sign up here.Lastly, join me for the MoneyShow Masters Symposium running May 14th through the 16th. I’ll be speaking about high-yield investing ideas and strategies. Click here for more details.
Barrick Mining Corporation
Business Overview
Barrick Mining Corporation, formerly known as Barrick Gold Corporation until its May 2025 rebrand, is one of the world’s leading gold and copper producers. The company’s geographically diversified portfolio of mining operations and development projects spans approximately 17 to 18 countries across five continents.
Headquartered in Toronto, Canada, Barrick Mining Corporation focuses on high-margin, long-life Tier One assets in the most prolific mining districts, emphasizing exploration, development, production, and sales of gold bullion, gold and copper concentrates, and copper cathodes.
The company’s core business operations rely on a decentralized owner-operator model that leverages advanced technology, autonomous mining, and integrated processing facilities to achieve efficiency and low unit costs. Major gold-producing complexes, such as the Nevada Gold Mines joint venture in the United States (61.5% owned by Barrick and operated as the largest integrated gold-producing complex globally), anchor the company’s North American footprint. At the same time, operations extend to Latin America, Africa, and the Asia-Pacific region, enabling Barrick to mitigate jurisdictional risks and maintain robust production volumes.
Gold operations form the backbone of Barrick’s business, with key assets including the Pueblo Viejo mine in the Dominican Republic (60% ownership), Loulo-Gounkoto in Mali (80%), Kibali in the Democratic Republic of Congo (45% joint venture), and additional sites like Veladero in Argentina (50%), North Mara and Bulyanhulu in Tanzania, and Porgera in Papua New Guinea. These involve a mix of open-pit and underground mining techniques, supported by sophisticated processing infrastructure, including mills, roasters, autoclaves, and heap-leach facilities—particularly within the interconnected Nevada network, which optimizes ore routing for maximum recovery.
On the copper side, Barrick has expanded its portfolio through assets like Lumwana in Zambia (100% ownership, with ongoing expansions), Zaldívar in Chile (50%), and Jabal Sayid in Saudi Arabia (50%), alongside major development projects such as Reko Diq in Pakistan (50%), which is slated to begin production around 2028. This diversification into copper supports the energy transition while complementing gold output, with attributable 2025 production guidance around 2.9–3.25 million ounces of gold and 190–220 thousand tonnes of copper, reflecting disciplined execution across its global network.
Barrick’s operational strategy prioritizes responsible mining, safety (under its “Zero Harm” ethos), and long-term sustainability through partnerships with host governments, communities, and joint-venture partners like Newmont and AngloGold Ashanti. Local hiring dominates its workforce of roughly 26,800 employees and 27,000 contractors, fostering skills development and mutual prosperity while investing in exploration to replenish reserves (89 million ounces of gold and 18 million tonnes of copper as of late 2024). A technology-driven approach, including autonomous equipment and data analytics, enhances efficiency and environmental performance, while strong cash flow generation in favorable commodity markets supports capital allocation for growth, dividends, and share repurchases. This model ensures resilient, high-return operations amid fluctuating metal prices and regulatory landscapes.
Investment Considerations
As a mining company, Barrick gives the Velocity Report portfolio added exposure to gold, with the added benefit of copper exposure.
Let’s start by looking at the 2025 fourth quarter financial results:
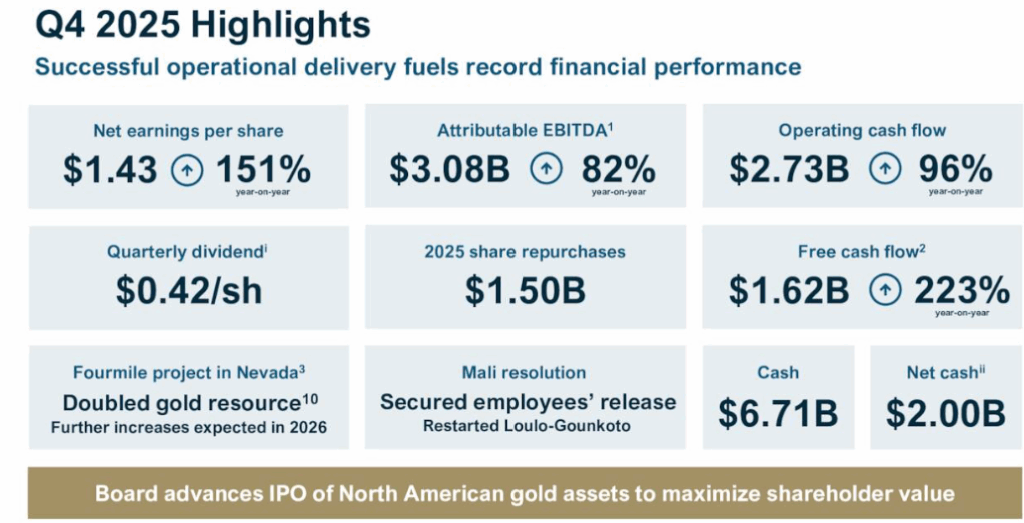
The potential IPO is one of the reasons that I picked this moment to add Barrick to the portfolio.
For the quarter, the company reported gold total cash cost (TCC) of $1,205 per ounce and all-in sustaining cost (AISC) of $1,581 per ounce. Those costs were up 6% and 3%, respectively, compared to the third quarter. Full-year TCC and AISC were up 13% and 10%, respectively, compared to 2024.
With the large gains in gold in the fourth quarter, gold revenue and EBITDA were up 40% and 52%, respectively, compared to the third quarter. Full-year revenue and EBITDA were up 28% and 51% compared to 2024.
Copper production, which accounted for 8% of adjusted EBITDA, saw revenue and EBITDA increase by 48% and 115%, respectively, for the full year.
This chart shows the massive increase in all of Barrick’s financial metrics:
| Summary Financials | Q4 2025 | Q3 2025 | % Change | FY 2025 | FY 2024 | % Change |
|---|---|---|---|---|---|---|
| Revenue ($ millions) | 5,997 | 4,148 | 45% | 16,956 | 12,922 | 31% |
| Net earnings ($ millions) | 2,406 | 1,302 | 85% | 4,993 | 2,114 | 133% |
| Adjusted net earnings ($ millions) | 1,754 | 982 | 79% | 4,139 | 2,213 | 87% |
| Attributable EBITDA1 ($ millions) | 3,084 | 2,022 | 53% | 8,157 | 5,185 | 57% |
| Operating cash flow ($ millions) | 2,726 | 2,422 | 13% | 7,689 | 4,491 | 71% |
| Free cash flow2 ($ millions) | 1,619 | 1,479 | 9% | 3,868 | 1,317 | 194% |
| Net earnings per share ($) | 1.43 | 0.76 | 88% | 2.93 | 1.22 | 140% |
| Adjusted net earnings per share ($) | 1.04 | 0.58 | 79% | 2.42 | 1.26 | 92% |
| Total attributable capital expenditures ($ millions) | 906 | 757 | 20% | 3,011 | 2,607 | 15% |
New Dividend Policy
Starting with the 2025 fourth quarter, the Barrick board of directors initiated a new dividend policy. The base dividend was increased by 40% to $0.175 per share, up from $0.125 per share. Current yield, based on the base dividend, is 1.8%.
Supplemental dividends will be paid, targeting a 50% payout of free cash flow. For the quarter, a total dividend of $0.42 per share was paid on March 16.
Note: the business overview at the beginning of this article of Barrick Mining Corporation (B) was written with the assistance of a large language model LLM. It has been vetted and edited by the Investors Alley editorial team. Analysis of the investment below the overview is written by Tim Plaehn.
Editor’s Personal Position: Long B
EQT Corporation
Business Overview
EQT Corporation operates as America’s leading vertically integrated natural gas producer, with its core business centered on the exploration, development, and production of natural gas, natural gas liquids (NGLs), and a small amount of crude oil in the Appalachian Basin.
Headquartered in Pittsburgh, Pennsylvania, the company maintains a substantial asset base spanning approximately 2.1 million gross acres across Pennsylvania, West Virginia, and Ohio, where it leverages advanced horizontal drilling and hydraulic fracturing techniques to extract hydrocarbons from the Marcellus and Utica shale formations.
EQT’s upstream focus accounts for roughly 99% of the company’s gross production, positioning EQT as the largest natural gas producer in the United States and contributing about 6% of the country’s total output. The company’s low-cost production strategy, supported by a peer-leading inventory of drilling locations and a commitment to operational efficiency, enables consistent output even amid market volatility. At the same time, recent achievements like net-zero Scope 1 and 2 emissions underscore its emphasis on sustainable practices.
In terms of day-to-day production operations, EQT’s upstream activities emphasize responsible development through technology-driven methods that minimize environmental impact, such as using recycled water in fracturing fluids and triple-casing well designs to protect groundwater.
The company holds proven reserves of about 26.3 trillion cubic feet of natural gas equivalent as of late 2024, with the majority located in the Marcellus Shale. Operations are concentrated in key counties like Greene and Washington in Pennsylvania (over one million net acres), Doddridge and surrounding areas in West Virginia (around 600,000 net acres), and Belmont County in Ohio (150,000 net acres), where multi-well pads and optimized completion designs drive high productivity.
Approximately 1,461 employees support these efforts and generate steady revenue through commodity sales, with 2024 total operating revenues reaching roughly $5.3 billion, reflecting efficient well performance and system optimizations that often exceed internal volume guidance.
EQT’s midstream operations provide critical vertical integration by handling the gathering, processing, and transportation of its produced volumes, distinguishing the company as the only large-scale integrated player in the U.S. natural gas sector. EQT owns and operates nearly 3,000 miles of pipeline infrastructure across the Appalachian Basin, complemented by its investment and operatorship in the Mountain Valley Pipeline (MVP), a 300-plus-mile system linking West Virginia to Virginia and beyond. Strategic moves, including the 2024 acquisition of Equitrans Midstream and a $3.5 billion joint venture with Blackstone Credit & Insurance, have expanded EQT’s network, creating stable, annuity-like cash flows from fee-based services, while enabling direct access to high-demand markets for power generation and LNG exports. This integrated model not only reduces reliance on third-party transporters but also supports long-term growth by aligning production expansion with emerging demand centers, all while prioritizing safety, community engagement, and low-emission practices.
Investment Considerations
For the 2025 fourth quarter, EQT reported production above the high end of previous guidance and capital and operating expenses 4% below the midpoint of guidance. The average realized sale price was $3.44 per Mcfe with total operating costs of $1.10 per Mcfe.
Adjusted EBITDA was $1.509 billion, with $744 million of free cash flow. For 2025, the company generated $2.5 billion in free cash flow, well above Wall Street’s $2.0 billion estimate.
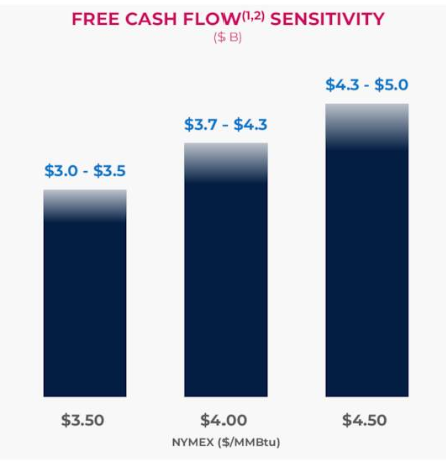
EQT is the lowest-cost natural gas producer. Owning its midstream assets lowers operating costs. This chart shows the expected 2026 free cash flow in billions at different natural gas prices:
After two years of maintaining the dividend level, EQT increased the dividend rate by 4.8% in October. The current yield is 1.04%.
We own EQT in the Velocity Report portfolio to have upstream natural gas exposure from the most efficient producer.
Note: the business overview at the beginning of this article of EQT Corporation (EQT) was written with the assistance of a large language model LLM. It has been vetted and edited by the Investors Alley editorial team. Analysis of the investment below the overview is written by Tim Plaehn.
Editor’s Personal Position: Long EQT
Diamondback Energy
Business Overview
Diamondback Energy, Inc. is an independent oil and natural gas company headquartered in Midland, Texas. Its core business operations center on the acquisition, development, exploration, and exploitation of unconventional onshore reserves exclusively within the Permian Basin in West Texas. The company maintains a substantial land position of approximately 869,000 net acres, divided between the Midland Basin (roughly 775,000 net acres) and Delaware Basin (about 94,000 net acres).
Diamondback’s activities are primarily focused on horizontal drilling and multi-zone co-development in stacked pay intervals such as the Wolfcamp, Spraberry, Dean, and Bone Spring formations. This approach leverages advanced stimulation techniques, such as hydraulic fracturing, to unlock oil-rich resources in low-permeability reservoirs and enable efficient extraction while maintaining operational control over the vast majority of its acreage.
Recent strategic acquisitions, including the Endeavor Energy Resources merger, have significantly expanded Diamondback’s scale, bolstering its drilling inventory to more than 8,800 gross economic locations at $50 per barrel oil prices, and supporting nearly two decades of development at current paces.
Operationally, Diamondback emphasizes capital efficiency, cost discipline, and technological innovation to drive production growth and returns. In 2025, the company averaged 497.2 thousand barrels of oil per day (MBO/d) and 921.0 thousand barrels of oil equivalent per day (MBOE/d), with oil comprising about 54% of total volumes; 2026 guidance calls for 500–510 MBO/d of oil and 926–962 MBOE/d overall.
The company’s development strategy involves drilling longer laterals (averaging more than 12,000 feet) at accelerated cycle times; utilizing lower proppant intensities than peers while achieving top-tier well performance in the Midland Basin; and shifting toward simul-frac completions and continuous pumping for faster execution.
Diamondback operates an average of 15 drilling rigs annually, completing hundreds of wells per year, with a focus on proved developed producing (PDP) reserves, which stood at 2,521 MMBOE at year-end 2025 (70% of total proved reserves of 3,618 MMBOE).
This low-cost structure, with drilling, completion, and equipping costs among the basin’s lowest, generates strong free cash flow even in volatile commodity environments, supported by an investment-grade balance sheet and disciplined capital allocation.
Complementing its upstream focus, Diamondback integrates midstream operations through its wholly owned subsidiary, Rattler Midstream Operating LLC, which owns and operates crude oil, natural gas, and produced water gathering systems under long-term, fixed-fee contracts that serve both the company and third-party producers. This vertical integration enhances takeaway capacity, reduces operational risks, and supports environmental goals such as increased recycled water usage and reduced flaring. The company also benefits from synergies with Viper Energy, Inc., in which it holds a significant interest, providing royalty exposure across its acreage.
Overall, Diamondback’s operations prioritize sustainability alongside returns—targeting Scope 1 and 2 GHG intensity reductions, methane emission cuts, and no routine flaring by 2025—while delivering consistent production growth, reserve replacement exceeding 100%, and substantial shareholder distributions through dividends and buybacks.
Investment Considerations
For the 2025 fourth quarter, Diamondback generated adjusted free cash flow (FCF) of $1.2 billion, or $4.14 per share. For the full year, the FCF numbers were $5.9 billion and $20.38 per share, respectively. The company generates substantial free cash flow.
Diamondback Energy has a policy of returning at least 50% of FCF to investors. The base dividend was increased by 5% in February to $1.05 per share per quarter. The dividend has grown for seven straight years, and the current yield is 2.12%.
The return of FCF above the base dividend can take the form of supplemental dividends or share buybacks. The company paid supplemental dividends for eight of the ten quarters from May 2022 through August 2024. Since the 2024 fourth quarter dividend, it has been focused on share buybacks. In the 2025 fourth quarter, $434 million in share buybacks occurred.
For 2023, the stock averaged $130 per share; for 2024, $175 per share; and for 2025, $150 per share. With the stock trading at FCF multiples in the single digits, it makes sense to buy in.
I am hoping that, with the big jump in oil prices this year, Diamondback will reward investors with supplemental cash dividends.
Note: the business overview at the beginning of this article of Diamondback Energy, Inc. (FANG) was written with the assistance of a large language model LLM. It has been vetted and edited by the Investors Alley editorial team. Analysis of the investment below the overview is written by Tim Plaehn.
Editor’s Personal Position: Long FANG
Portfolio Update
Dividend Changes
On March 27, InfraCap Small Cap Income ETF (SCAP) declared a $0.245 per share quarterly dividend, a 2.1% increase from prior dividend of $0.240. This dividend was paid on March 31; ex-dividend was March 30.
Here is a rundown on the current dividend status for each of the Velocity Report portfolio stocks:
Abbvie Inc. (ABBV) declared a $1.73 dividend on February 19. Payment is May 15; ex-dividend is April 15. The current yield is 3.30%.
American Financial Group (AFG) declared a $0.88 dividend on January 2. Payment was January 27. The current yield is 5.58%.
Federal Agricultural Mortgage Corp. (AGM) declared a $1.60 dividend on February 20. Payment was March 31; ex-dividend was March 16. The current yield is 4.52%.
Antero Midstream (AM) declared a $0.225 dividend on January 14. Payment was February 11. The current yield is 3.88%.
CME Group Inc. (CME) declared a $1.30 dividend on February 12. Payment was March 26; ex-dividend was March 10. The current yield is 3.86%.
EQT Corporation (EQT) declared a $0.165 dividend on February 5. Payment was March 2. The current yield is 0.98%.
Diamond Back Energy, Inc (FANG) declared a $1.05 dividend on February 24. Payment was March 12; ex-dividend was March 5. The current yield is 2.08%.
Fidelity National Financial (FNF) declared a $0.52 dividend on February 20. Payment was March 31; ex-dividend was March 17. The current yield is 4.55%.
Kodiak Gas Services (KGS) announced a $0.49 dividend on January 29. Payment was February 20. The current yield is 3.35%.
Liberty Energy (LBRT) announced a $0.09 dividend on January 20. Payment was March 18; ex-dividend was March 4. The current yield is 1.24%.
Marathon Petroleum Corp (MPC) declared a $1.00 per share dividend on January 30. Payment was March 10. The current yield is 1.59%.
Blue Owl Capital, Inc. (OWL) announced a $0.225 dividend on February 5. Payment was March 2. The current yield is 10.18%.
Bank OZK (OZK) announced a $0.46 dividend on January 2. Payment was January 20. The current yield is 4.13%.
Royal Gold, Inc (RGLD) declared a $0.475 per share dividend on February 26. Payment is April 16; ex-dividend is April 2. The current yield is 0.80%.
InfraCap Small Cap Income ETF (SCAP) declared a $0.240 monthly dividend on March 27. Payment was March 31; ex-dividend was March 30. The current yield is 7.38%.
Simon Property Group (SPG) announced a $2.20 dividend on February 2. Payment was March 31; ex-dividend was March 10. The current yield is 4.88%.
VICI Properties Inc. (VICI) announced a $0.45 dividend on March 5. Payment is April 9; ex-dividend was March 19. The current yield is 6.76%.
Walmart Inc, (WMT) announced a $0.235 dividend on February 19. Payment is April 6, ex-dividend was March 20. The current yield is 0.81%.