Your free beta access to Rick Rouse’s alerts expire April 30th.
To continue receiving free access, you must submit your feedback about how I’m doing using this Google Forms link —> CLICK HERE
We closed our first trade for a 111% winner. For me to consider continuing this product beyond April 30th, I need your feedback now.
Pre-Market Update for 4/30/2021
S&P 500/ Nasdaq Tag Record Highs
8:00am (EST)
The stock market hit record levels on Thursday’s open but was somewhat choppy afterwards as Wall Street weighed a batch of better-than-expected Tech earnings and proposals from President Biden’s first address before a joint session of Congress.
A rise in treasury yields slowed momentum before a recovery afterwards with more key earnings updates, including Amazon.com (AMZN) and Twitter (TWTR), after the closing bell.
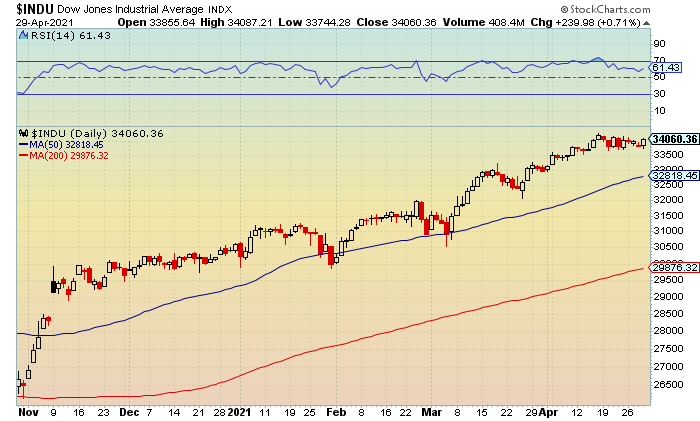
The Dow rebounded after trading to an afternoon high of 34,087 while ending at 34,060 (+0.7%). Current and lower resistance at 34,000-34,250 was recovered. A move above the latter and the mid-month all-time peak at 34,256 would indicate additional upside towards 34,500-34,750
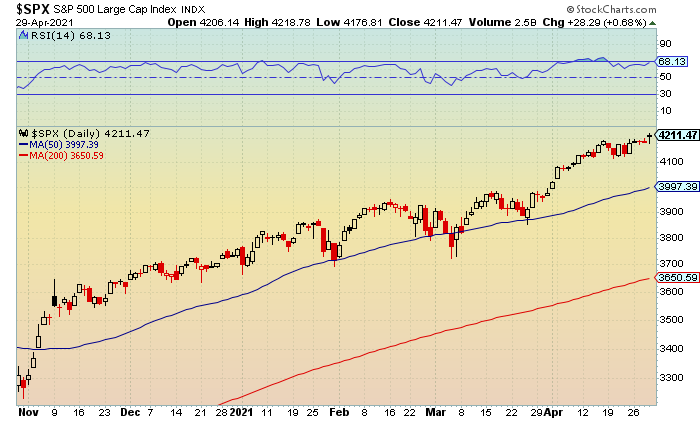
The S&P 500 closed at 4,211 (+0.7%) with the record high hitting 4,218. Key resistance at 4,200 was breached and held. Continued closes above this level keeps additional upside towards 4,225-4,250 in play.
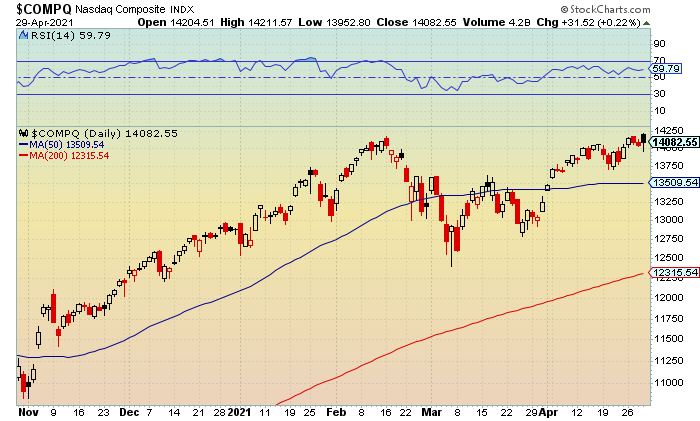
The Nasdaq finished at 14,082 (+0.2%) after trading to an intraday all-time high of 14,211. Unchartered territory and lower resistance at 14,200-14,350 was cleared but held. A pop above the latter would suggest ongoing strength towards 14,500-14,650.
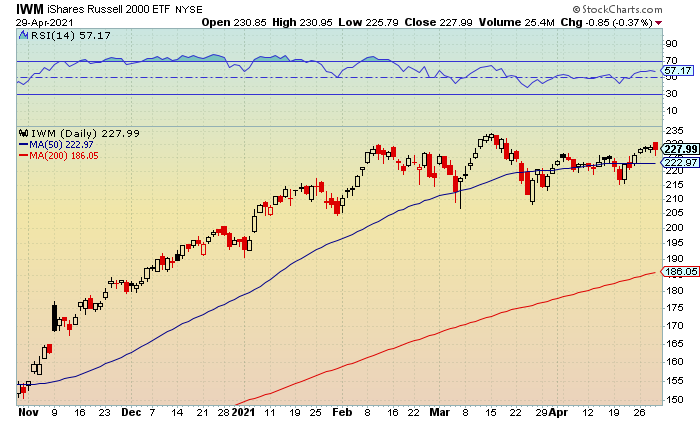
The Russell 2000 settled at 2,295 (-0.4%) after having its four-session winning streak snapped on the midday pullback to 2,278. Near-term and upper support at 2,300-2,275 failed to hold. A drop below the latter would signal a retest towards 2.250-2,225 and the 50-day moving average. Below is a chart of the IWM.
Market Movers
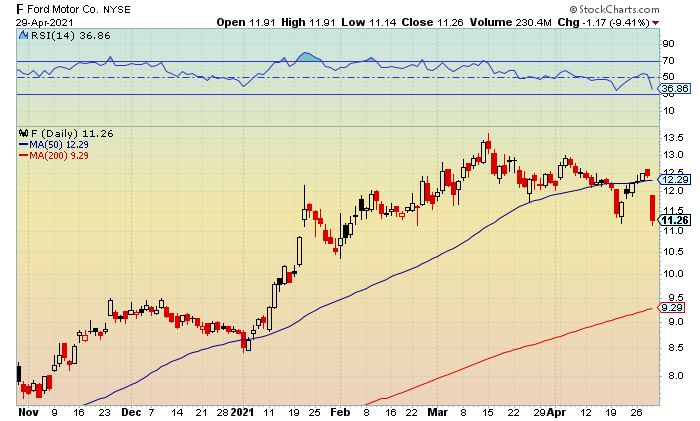
Shares of Ford (F) stumbled 9% despite reporting better-than-expected earnings and revenue. The company warned it will lose 10% of planned second-half 2021 production due to consequences from the semiconductor shortage, which it said was made worse by a recent supplier fire in Japan.
Volatility Index
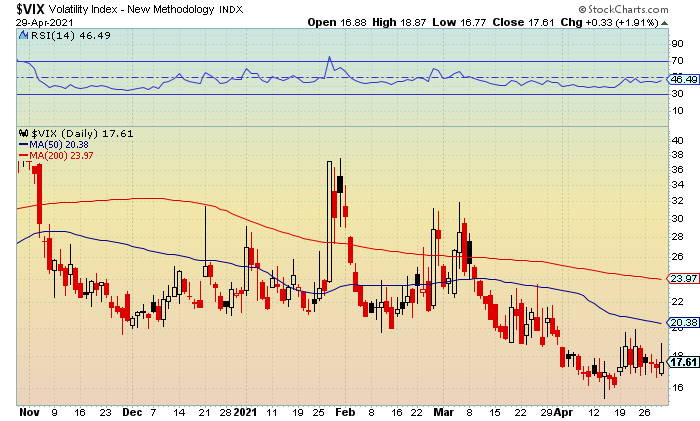
The iPath S&P Vix Short-Term Futures (NYSE: VIX) rose for the first time in three sessions after spiking to a high of 18.87. Prior and lower resistance at 18.50-19 was breached but held. A close above the latter would suggest strength towards 20-20.50 and the 50-day moving average.
Support is at 17-16.50 followed by 16-15.50.
Market Analysis
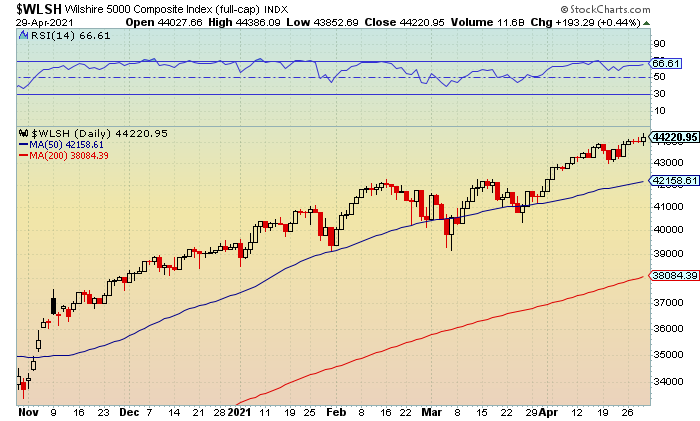
The Wilshire 5000 Composite Index (NYSE: WLSH) snapped a two-session slide with the intraday high tapping 44,386. Unchartered territory and lower resistance at 44,250-44,500 was cleared but held. A move above the latter would indicate ongoing strength towards 44,750-45,000.
Support is at 44,000-43,750.
RSI (relative strength index) is in a slight uptrend with key resistance at 70 holding. Continued closes above this level would suggest strength towards 75 and the early January high. Support is at 65-60 with the latter holding since the start of the month.
Sector
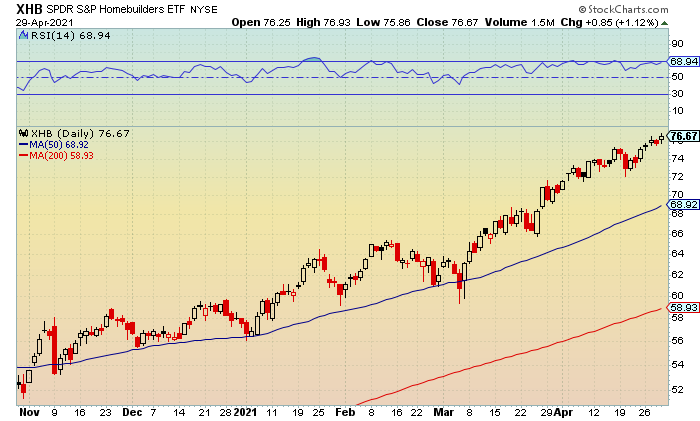
The SPDR S&P Homebuilders ETF (NYSE: XHB) was up for the fourth time in five sessions following the intraday run to $76.93 and fresh all-time peak. New and lower resistance at $76.50-$77 was breached and held. A close above the latter would signal additional momentum towards $78-$78.50.
Support is at $76-$75.50.
RSI has curled higher with key resistance at 70 holding. A close above this level would suggest additional strength towards 75 and overbought levels from mid-January. Support is at 65-60.
Market Outlook
Amazon.com and Twitter reported better-than-expected numbers after Thursday’s close and could keep Tech trending higher. The close above 17.50 on the VIX was a slight concern with a close below this level likely indicating strength into next week. May is typically known as the month to sell and go away but in recent years has been bullish.
Options Play List
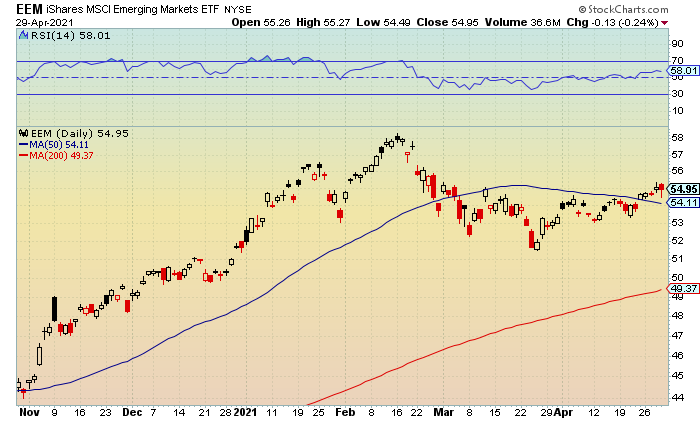
iShares MSCI Emerging Markets ETF (EEM, $54.95, down $0.13)
EEM May 55 calls (EEM210521C00055000, $0.90, down $0.10)
Entry Price: $1.00 (4/5/2021)
Exit Target: $2.00
Return: -10%
Stop Target: None
Action: Shares tested a low of $54.59 with current and upper support at $55-$54.50 failing to hold. Resistance remains at $54.50-$54 and the 50-day moving average.
Pre-Market Update for 4/29/2021
Fed Update Lifts Stocks Off Lows
8:00am (EST)
The stock market was choppy heading into the latest update from the Federal Reserve on Wednesday but gained momentum after the announcement of holding interest rates near-zero. The minutes were a little more upbeat than last month, noting progress on vaccinations and strong policy support are helping strengthen economic indicators, including employment.
The Fed reiterated the path of the economy will depend significantly on the course of the virus, including progress on vaccinations. The turnaround off the session lows but slightly lower close remains a bullish setup heading into the last two trading days of April with first-quarter earnings remaining strong.
The Russell 2000 reached an afternoon high of 2,309 before finishing at 2,304 (+0.1%). Lower resistance at 2,310-2,335 was challenged but held. A move above the latter would suggest additional strength towards 2,350-2,375 with the all-time peak at 2,360. Below is a chart of the IWM.
The S&P 500 tagged a record peak of 4,201 while closing slightly lower at 4,183 (-0.1%). Unchartered territory and key resistance at 4,200 was cleared but held. A close above this level would indicate a breakout towards 4,225-4,250.
The Nasdaq ended at 14,051 after tapping a second half high of 14,133 (-0.3%). Key resistance at 14,150 was challenged but held. A pop above this level and the record high at 14,175 would indicate momentum towards 14,250-14,400.
The Dow traded in negative territory throughout the session while settling at 33,820 (-0.5%) with the morning low hitting 33,805. Near-term and upper support at 33,750-33,500 was challenged but held. A drop below the latter would signal weakness towards 33,250-33,000.
Market Movers
Starbucks (SBUX) slid 3% after reporting an earnings beat but lower-than-expected revenue, with the company citing the resurgent in coronavirus restrictions in China weighing on sales.
Volatility Index
The iPath S&P Vix Short-Term Futures (NYSE: VIX) fell for the second-straight session after kissing a low of 16.67. Upper support at 17-16.50 was breached but held for the sixth-straight session. A close below the latter would signal weakness towards 16-15.50 with the 52-week and mid-month low at 15.38.
Resistance remains at 18-18.50 with the latter holding for the fourth-straight session.
Market Analysis
The iShares Russell Growth 1000 ETF (NYSE: IWF) fell for the second-straight session with the late day low hitting $260.64. Current and upper support at $261-$260.50 failed to hold. A move below the latter would suggest further risk towards $259-$258.50.
Resistance is at $262-$262.50 with Tuesday’s all-time peak at $262.70.
RSI has flatlined with key support at 60 holding. A close below this level would signal additional weakness towards 55-50 and levels from late March. Resistance is at 65-70.
Sector
The Health Care Select Sector SPDR Fund (NYSE: XLV) extended its losing streak to three-straight sessions after testing an intraday low of $121.96. Near-term and upper support at $122-$121.50 was breached but held. A close below the latter would indicate weakness towards $120.50-$120.
Resistance is at $123-$123.50 with last Friday’s all-time high at $123.96.
RSI is in a downtrend with upper support at 65-60 holding. A close below the latter would indicate additional weakness towards 55-50 and levels from mid-March. Resistance is at 70-75.
Options Play List
iShares MSCI Emerging Markets ETF (EEM, $55.08, up $0.41)
EEM May 55 calls (EEM210521C00055000, $0.95, up $0.15)
Entry Price: $1.00 (4/5/2021)
Exit Target: $2.00
Return: -5%
Stop Target: None
Action: Wednesday’s peak reached $55.34 with prior and lower resistance from the start of March at $55-$55.50 getting cleared and holding. Support remains at $54.50-$54 and the 50-day moving average.
Pre-Market Update for 4/28/2021
Market Mixed Ahead a Key Earnings/ Fed Minutes
8:00am (EST)
The stock market was mixed on Tuesday as Wall Street awaited more corporate earnings results from major companies and the upcoming Federal Reserve monetary policy decision. Big Tech companies will be closely watched, with these stocks having largely underperformed against the broader market rally following the rotation into cyclical and value stocks.
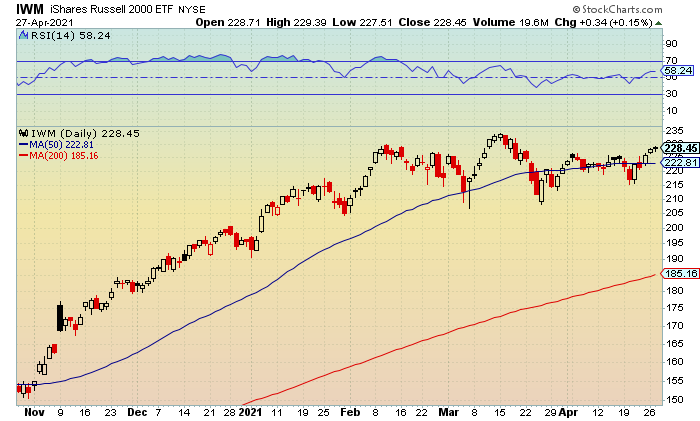
The Russell 2000 continues to outperform after settling at 2,301 (+0.1%) while testing a first half peak of 2,309. Lower resistance from early March at 2,300-2,325 was recovered. A close above the latter would indicate ongoing strength towards 2,350-2,375 with the all-time peak at 2,360. Below is a chart of the IWM.
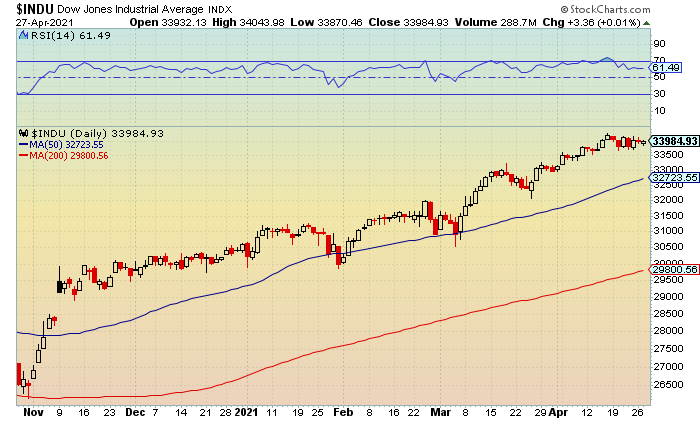
The Dow traded to an afternoon high of 34,043 before closing at 33,984 (+0.01%). Current and lower resistance at 34,000-34,250 was breached but held. A move above the latter and the recent all-time peak at 34,256 would suggest additional upside towards 34,500-34,750.
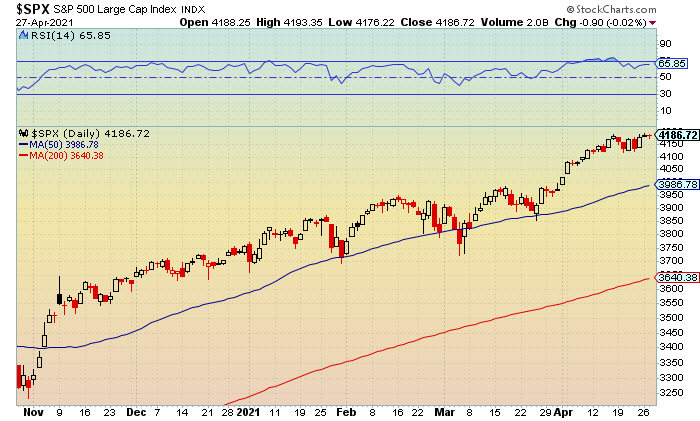
The S&P 500 finished at at 4,186 (-0.02%) after tagging a morning low of 4,176. Near-term and upper support at 4,175-4,150 was challenged but held. A drop below the latter would signal a further fade towards 4,125-4,100.
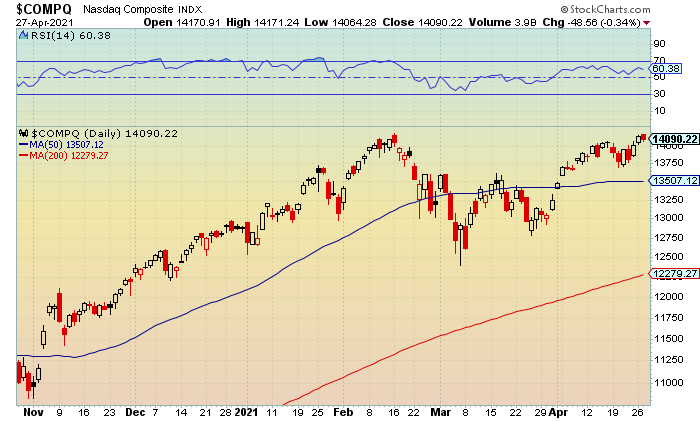
The Nasdaq tested an intraday low of 14,064 while ending at 14,090 (-0.3%). Key support at 14,000 easily held. A close below this level would indicate additional weakness towards 13,900-13,750.
Market Movers
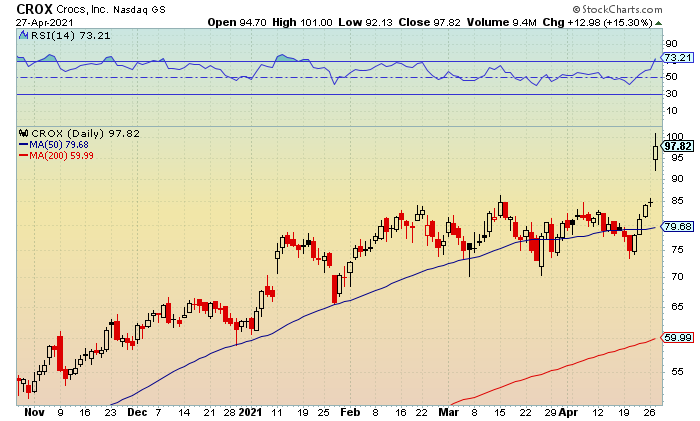
Shares of Crocs (CROX) jumped 15% after reporting earnings of $1.49 a share on revenue of $460 million. Forecasts were at 89 cents a share on revenue of $415 million.
Volatility Index
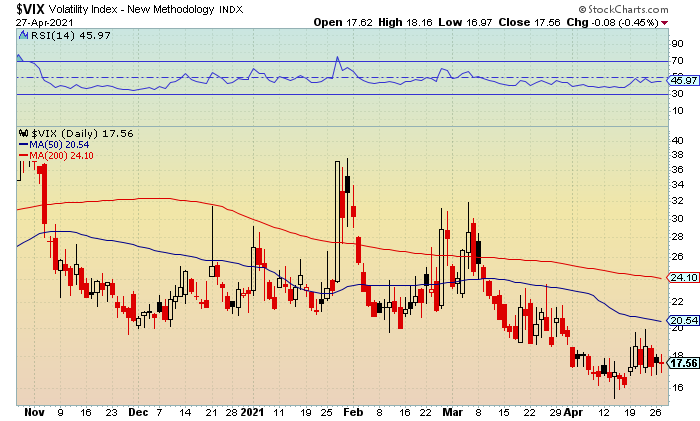
The iPath S&P Vix Short-Term Futures (NYSE: VIX) remained in a seven session trading range with the low tapping 16.97. Upper support at 17-16.50 was breached but held. A close below the latter would signal a retest towards 16-15.50.
Resistance remains at 18-18.50.
Market Analysis
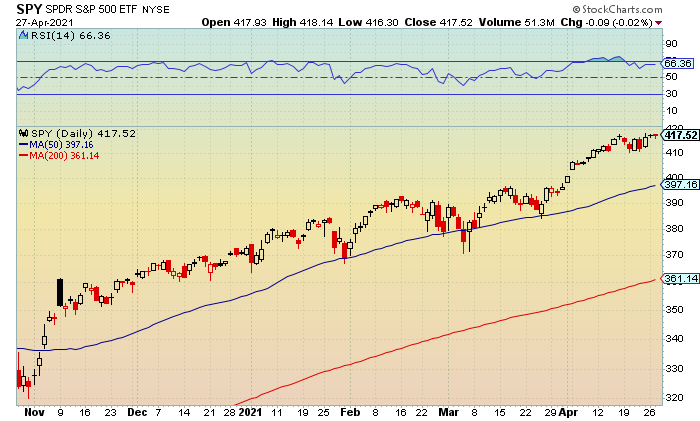
The SPDR S&P 500 ETF (NYSE: SPY) was down for the first time in three sessions after trading to a low of $416.30. Current and upper support at $416.50-$416 was tripped but held. A close below the latter would indicate additional weakness towards $414.50-$414.
Resistance is at $418-$418.50 with last Friday’s all-time peak at $418.25.
RSI (relative strength index) has flatlined with key resistance at 70 holding. A close above this level would suggest a run towards 75 and slightly overbought territory from earlier this month. Support is at 65-60.
Sector
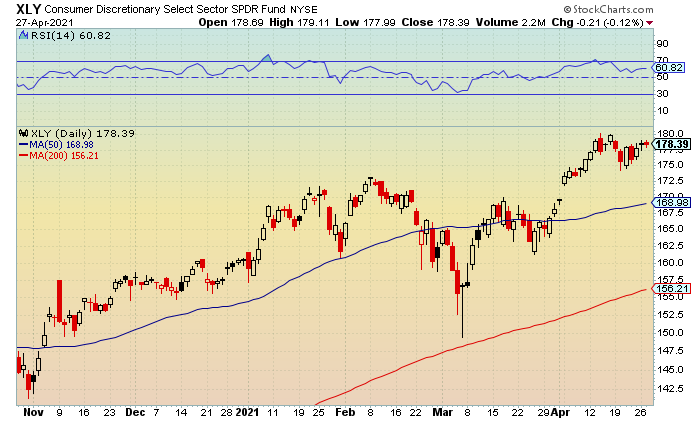
The Consumer Discretionary Select Spiders (NYSE: XLY) had its two-session winning streak snapped following the intraday pullback to $177.99. Near-term and upper support at $178-$177.50 was breached but held. A close below the latter would likely signal a further slide towards $176-$175.50.
Resistance is at $179-$179.50 with the mid-month record peak at $180.16.
RSI has rolled over with key support at 60 holding. A close below this level would suggest a retest towards 55-50. Resistance is at 65-70.
Market Outlook
Boeing (BA), CME Group (CME), Discovery Communications (DISCA), Garmin (GRMN), Wingstop (WING) and Yum Brands (YUM) are announcing numbers ahead of the opening bell this morning.
Apple (AAPL), Cheesecake Factory (CAKE), eBay (EBAY), Facebook (FB), Ford Motor (F), MGM Resorts International (MGM) and Qualcomm (QCOM) are the major companies announcing after the close.
Options Play List
iShares MSCI Emerging Markets ETF (EEM, $54.67, down $0.03)
EEM May 55 calls (EEM210521C00055000, $0.80, unchanged)
Entry Price: $1.00 (4/5/2021)
Exit Target: $2.00
Return: -20%
Stop Target: None
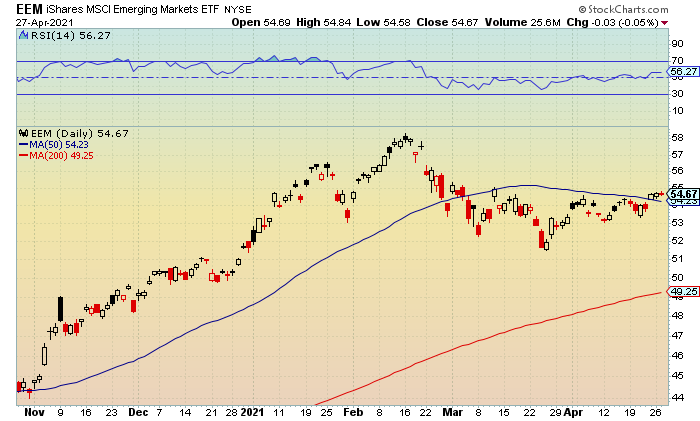
Action: Shares tagged an intraday day high of $54.84 before closing slightly in the red. Lower resistance from early March at $54.75-$55.25 was breached but held for the second-straight session. Support is at $54.50-$54 and the 50-day moving average.
Pre-Market Update for 4/27/2021
Bulls Regain Momentum
8:00am (EST)
The stock market showed continued strength on Monday ahead of the busiest week for first-quarter earnings and the start of the Fed’s two-day policy meeting. For the S&P 500 companies that have reported results thus far, 84% have topped estimates and would represent the highest number recorded if this trend holds.
Wall Street is expecting the Federal Reserve will remain ultra-accommodative and is not really looking for any surprises or significant changes in the outlook versus March. Meanwhile, volatility was slightly higher despite the higher market close after failing to hold a key level of support for the sixth-straight session.
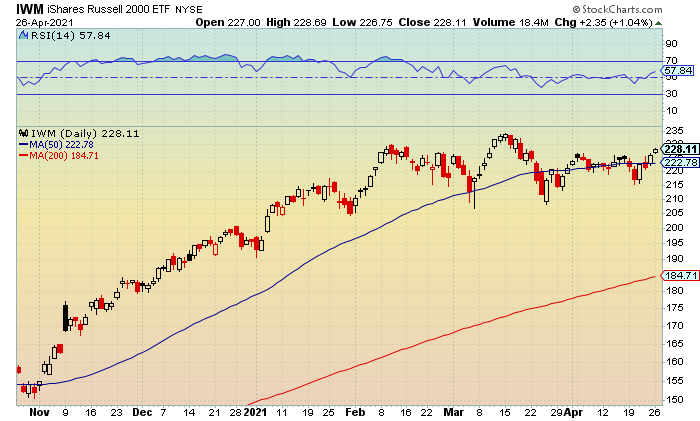
The Russell 2000 tested a midday high of 2,302 before closing at 2,298 (+1.2%). Prior and lower resistance from early March at 2,300-2,325 was breached but held. A rise above the latter would signal momentum towards 2,350-2,375 with the all-time peak at 2,360. Below is a chart of the IWM.
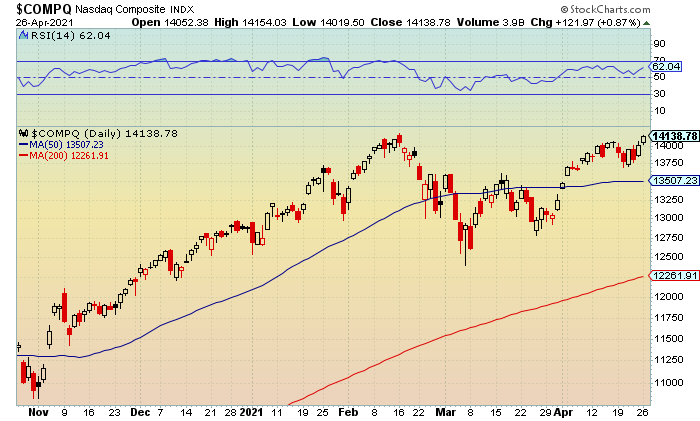
The Nasdaq tapped an intraday peak of 14,154 while finishing at 14,138 (+0.9%). Key resistance at 14,150 was cleared but held. A close above this level and the record high at 14,175 would indicate a breakout towards 14,250-14,400.
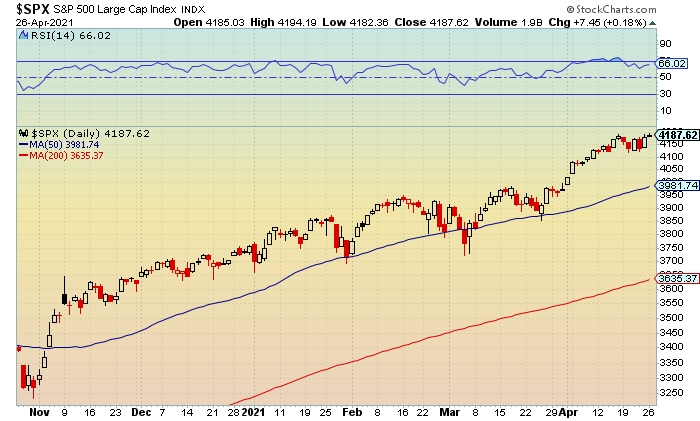
The S&P 500 made a run to 4,194 before ending at 4,187 (+0.2%). Key resistance at 4,200 was challenged but held for the second-straight session. A move above this level would suggest ongoing strength towards 4,225-4,250 and fresh record highs.
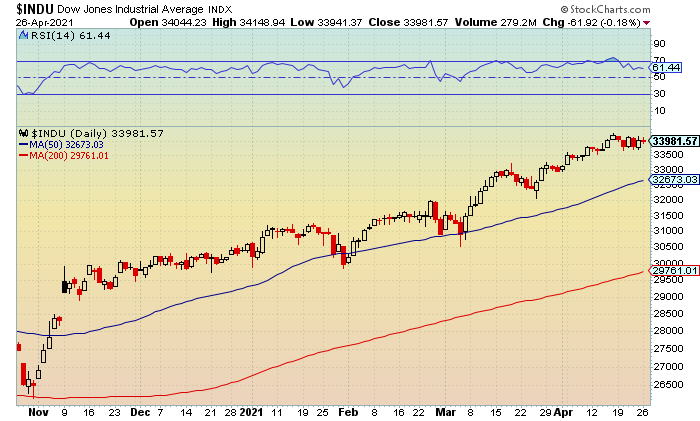
The Dow settled in the red at 33,981 (-0.2%) with the late day low tagging 33,941. Near-term and upper support at 34,000-33,750 failed to hold. A drop below the latter would signal weakness towards 33,500-33,250.
Market Movers
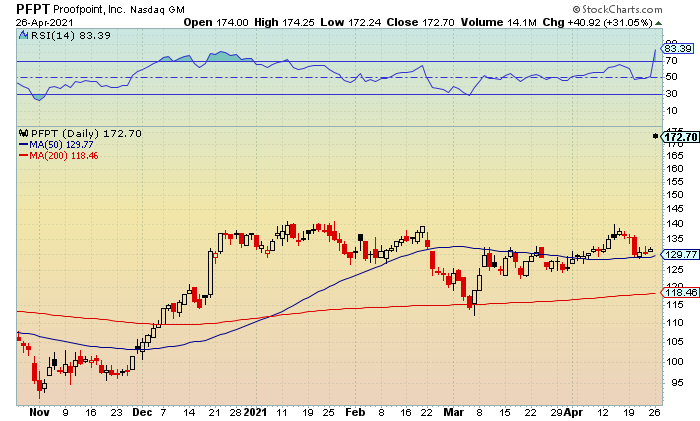
Proofpoint (PFPT) shares surged 31% after the company agreed to be acquired by Thoma Bravo for $176 a share in cash that values the company at roughly $12.3 billion. Proofpoint also reported better-than-expected first-quarter earnings and revenue but suspended its 2021 financial guidance.
Volatility Index
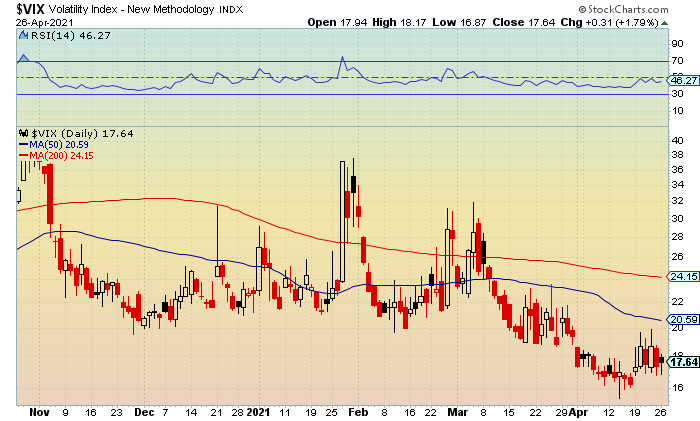
The iPath S&P Vix Short-Term Futures (NYSE: VIX) continued its seesaw action after testing a first half low of 16.87. Upper support at 17-16.50 was breached but held for the sixth-straight session.
The bounce to 18.17 afterwards cleared bit held lower resistance at 18-18.50.
Market Analysis
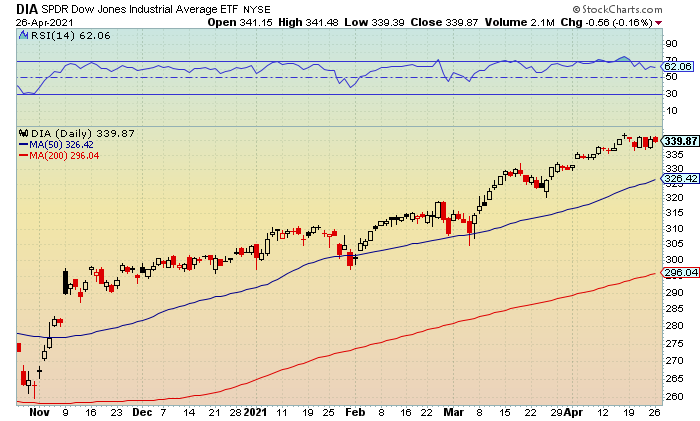
The Spiders Dow Jones Industrial Average ETF (NYSE: DIA) was down for the second time in three sessions with the low hitting $339.39. Current and upper support at $339.50-$339 was tripped but held. A close below the latter would signal weakness towards the $375.50-$337 area.
Resistance is at $341.50-$342 with the all-time peak from earlier this month at $342.43.
RSI is in a slight downtrend with key resistance at 60 holding. A move below this level would indicate additional weakness towards 55-50. Resistance is at 65-70.
Sector
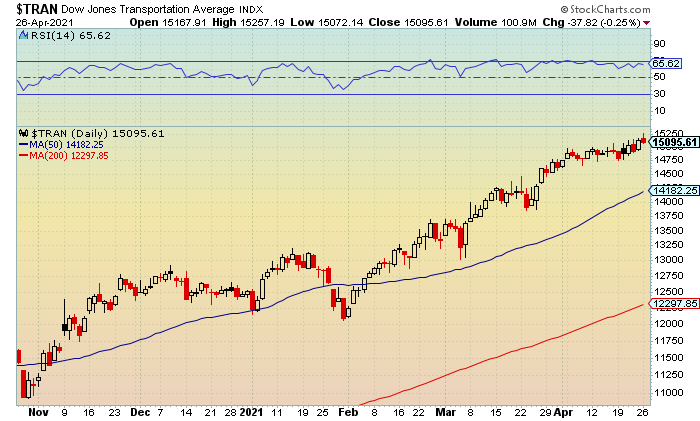
The Dow Jones Transportation Average (NYSE: TRAN) tested a fresh all-time high of 15,257 before closing slightly lower. Unchartered territory and key resistance at 15,250 was breached but held. A close above this level would indicate additional momentum towards 15,350-15,500.
Current support is at 15,00-14,850. A close below 14,750 would signal a possible near-term top.
RSI has leveled out with upper support at 65-60 holding. A close below the latter would signal weakness strength towards 55-50 and early March lows. Key resistance is at 70.
Market Outlook
We were able to close another winning trade yesterday to get the track record to 17-4 for 2021 with a nice 52% winner. I’m still looking for a profit with our current position and would like to open another new trade this week. There are couple at the top of my list that have earnings this week so there may be an opportunity once the news is out of the way.
One of them is Good Year Tire & Rubber (GT) with numbers due out on Friday. The other is Levi Strauss (LEVI) if shares clear the $30 level. As usual, if I take action, I will send out a Trade Alert.
Options Play List
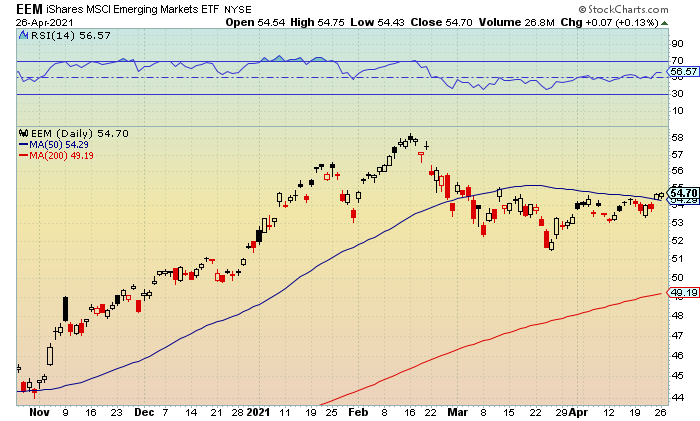
iShares MSCI Emerging Markets ETF (EEM, $54.70, up $0.07)
EEM May 55 calls (EEM210521C00055000, $0.80, unchanged)
Entry Price: $1.00 (4/5/2021)
Exit Target: $2.00
Return: -20%
Stop Target: None
Action: Shares tested an intraday day high of $54.75 with prior and lower resistance from early March at $54.75-$55.25 getting breached but holding. Support is at $54.25-$53.75 and the 50-day moving average.
Pre-Market Update for 4/26/2021
Bears Get First Weekly Win in Five Weeks
8:00am (EST)
The stock market rebounded on Friday with the gains nearly giving the bulls the weekly win. However, the bears did just enough damage throughout the week to get their first overall victory in five weeks.
The rally was enough to lift the small-caps to a weekly gain with the S&P 500 setting a fresh all-time intraday peak in the process. Volatility also settled lower and below a key level of support ahead of the heart of the first-quarter earnings season and the end of month countdown.
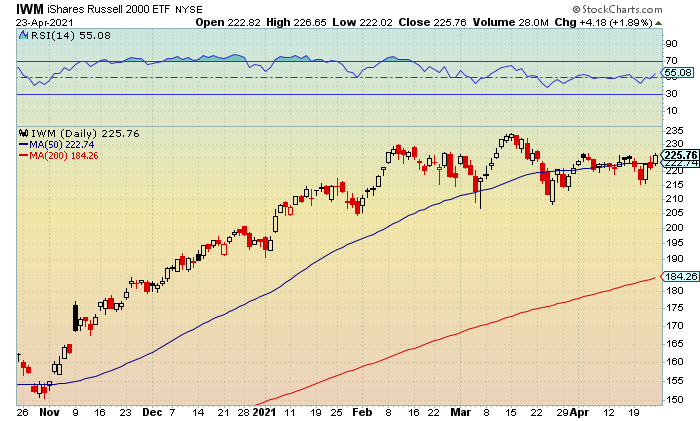
The Russell 2000 settled at 2,271 (+1.8%) with the afternoon high tapping 2,281. Prior and lower resistance at 2,275-2,300 was cleared but held. A move above the latter would suggest additional strength towards 2,325-2,350 with the all-time top from mid-March at 2,360. Below is a chart of the IWM.
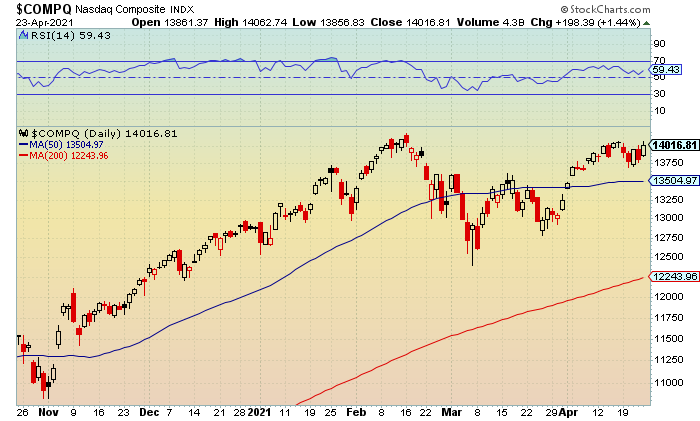
The Nasdaq ended at 14,016 (+1.4%) with the late day peak hitting 14,062. Near-term and lower resistance at 14,050-14,150 was breached but held. A close above the latter and the record high at 14,175 would likely lead to a breakout towards 14,250-14,400.
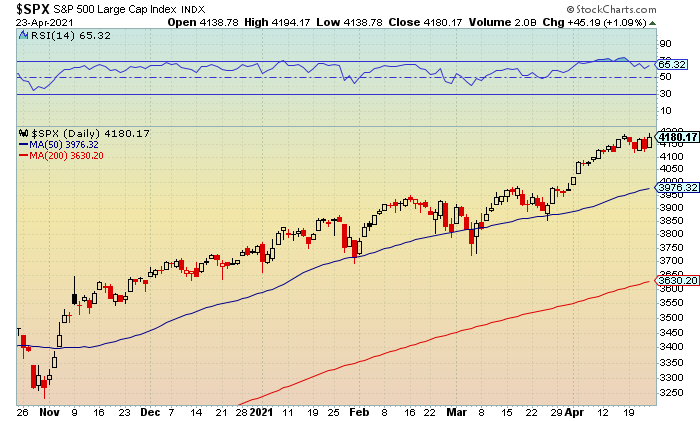
The S&P 500 closed at 4,180 (+1.1%) after reaching a record peak of 4,194 ahead of the closing bell. Current and lower resistance at 4,175-4,200 was recovered. A pop above the latter would indicate momentum towards 4,225-4,250.
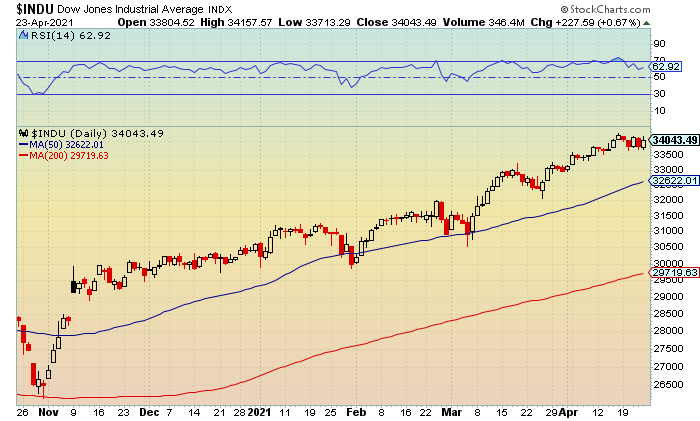
The Dow traded to a second half high of 34,157 while finishing at 34,043 (+0.7%). Lower resistance at 34,000-34,250 was reclaimed. A move above the latter and the recent all-time peak at 34,256 would signal ongoing strength towards 34,500-34,750.
Market Movers
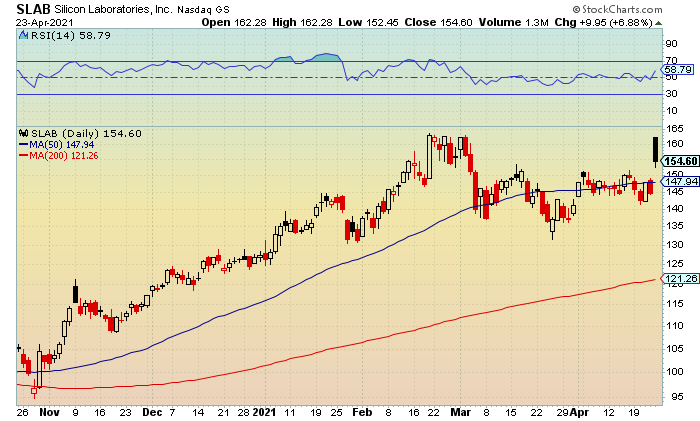
Shares of Silicon Labs (SLAB) rose nearly 7% after the company agreed to sell its Infrastructure & Automotive business to Skyworks Solutions (SWKS) for $2.75 billion.
Volatility Index
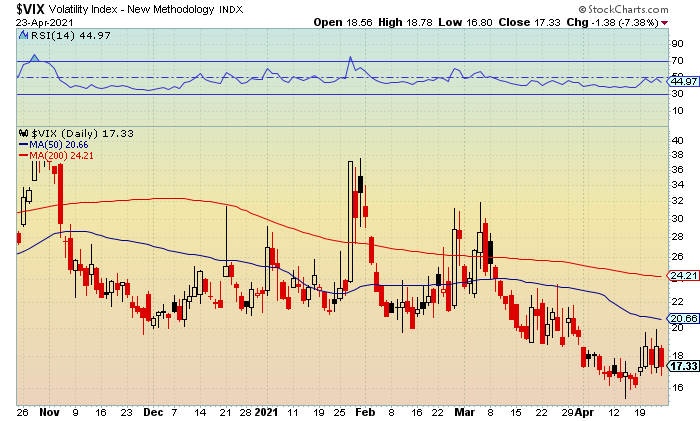
The iPath S&P Vix Short-Term Futures (NYSE: VIX) zigzagged for the fourth-straight session with the low tapping 16.80. Current and upper support at 17-16.50 was breached but held. A close below the latter would signal a retest towards 15.50-15.
Resistance is at 18-18.50 followed by 20-20.50 and the 50-day moving average..
Market Analysis
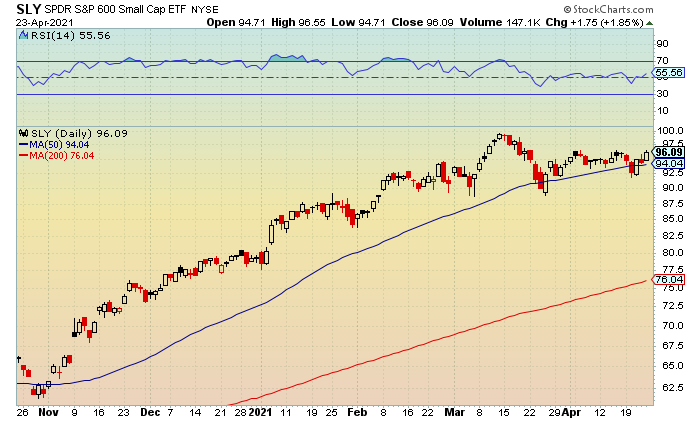
The Spider Small-Cap 600 ETF (NYSE: SLY) was up for the second time in three sessions following the intraday run to $96.55. Near-term and lower resistance at $96.50-$97 was cleared but failed to hold. A close above the latter would suggest additional strength towards $98-$98.50 with the all-time peak from mid-March at $99.71.
Support is at $95.50-$95 followed by $94-$93.50 and the 50-day moving average.
RSI (relative strength indicator) is back in a slight uptrend with lower resistance at 55-60 getting recovered. A move above the latter would suggest additional upside towards 65-70. Support is at 50-45.
Sector
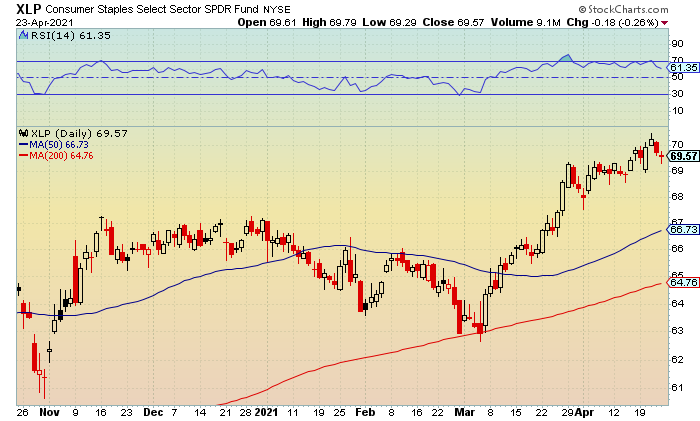
The Consumer Staples Select SPDR Fund (NYSE: XLP) was down for the second-straight session after trading to a low of $69.29. Current and upper support at $69.50-$69 was tripped but held. A close below the latter would indicate additional weakness towards $68-$67.50.
Resistance is at $70-$70.50 with last Wednesday’s all-time high at $70.47.
RSI is in a downtrend with key support at 60 holding. A close below this level would suggest downside pressure towards 55-50. Resistance is at 65-70.
Market Outlook
I mentioned the current action would test our patience and the key for last week would be if the volatility could hold 20. Friday’s close below 17.50 was a slightly bullish signal and comes after the 20 level was challenged but held three times last week.
I also said the bulls would need a Hail Mary to win the week and they nearly pulled it off. This week will be filled with major earnings from a number of Tech companies and will likely be the catalyst for the Nasdaq in making a run at fresh all-time highs, or a possible near-term top.
Tesla (TSLA) earnings out after today’s close and will likely set the tone for Tuesday’s session. On that note, I could have another new trade, today or tomorrow, depending on the action.
Options Play List
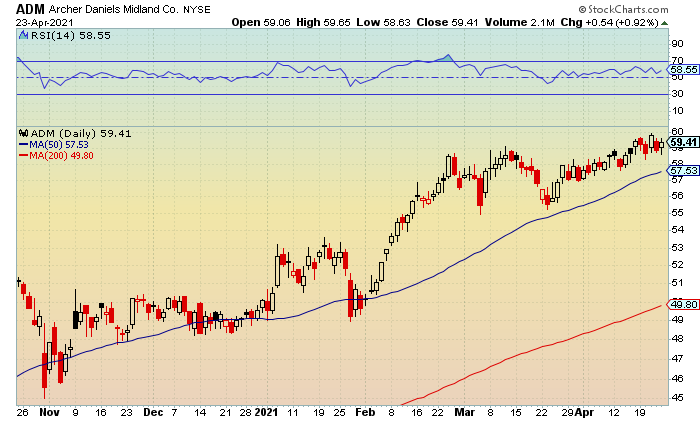
Archer Daniels Midland Company (ADM, $59.41, up $0.54)
ADM May 60 calls (ADM210521C00060000, $1.25, up $0.20)
Entry Price: $1.15 (4/16/2021)
Exit Target: $2.30
Return: 9%
Stop Target: None
Action: Friday”s peak reached $59.65 with near-term and lower resistance at $59.50-$60 getting cleared but failing to hold. A close above the latter and last Wednesday’s all-time peak at $59.94 would suggest a breakout towards $61-$51.50. Support is at $59-$58.50.
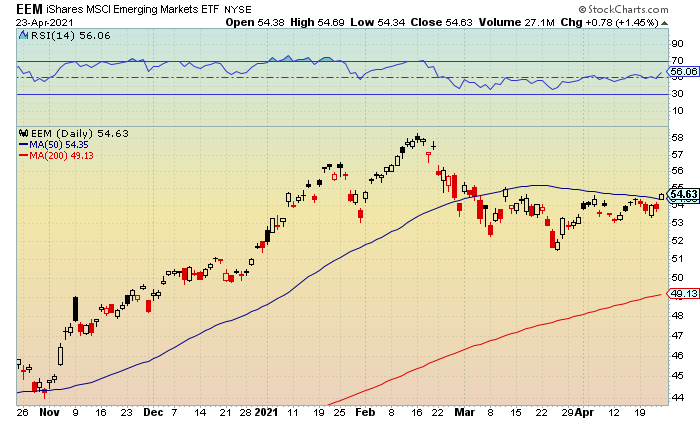
iShares MSCI Emerging Markets ETF (EEM, $54.63, up $0.78)
EEM May 55 calls (EEM210521C00055000, $0.80, up $0.20)
Entry Price: $1.00 (4/5/2021)
Exit Target: $2.00
Return: -20%
Stop Target: None
Action: Shares tested an intraday day high of $54.59 with lower resistance at $54.25-$54.75 and the 50-day moving average getting recovered. A close above the $55 level would suggest a retest towards $55.50-$56. Support is at $54-$53.50.
Pre-Market Update for 4/23/2021
Volatility Spikes Towards 20
8:00am (EST)
The stock market erased opening gains to trade lower on Thursday following news President Biden is set to propose a plan that could nearly double the capital gains taxes on the wealthy. The proposal would boost the rate to 39.6% for individuals earning $1 million or more, an increase from the current rate of 20%.
The continued rise in coronavirus cases globally, notably the surge in India, also weighed on sentiment as the possibility of a delay to the expected global recovery rises along with infections. Meanwhile, volatility spiked to its highest level since late March while holding a key level of resistance.
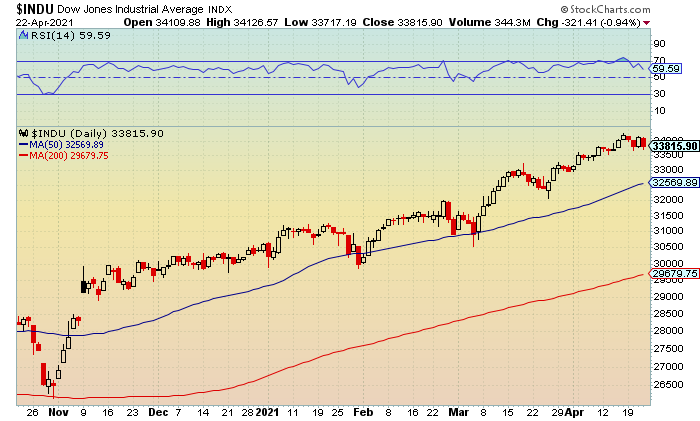
The Dow tested an intraday low of 33,717 before settling at 33,815 (-0.9%). Current and upper support at 33,750-33,500 was tripped but held. A close below the latter would indicate a further drop towards 33,250-33,000.
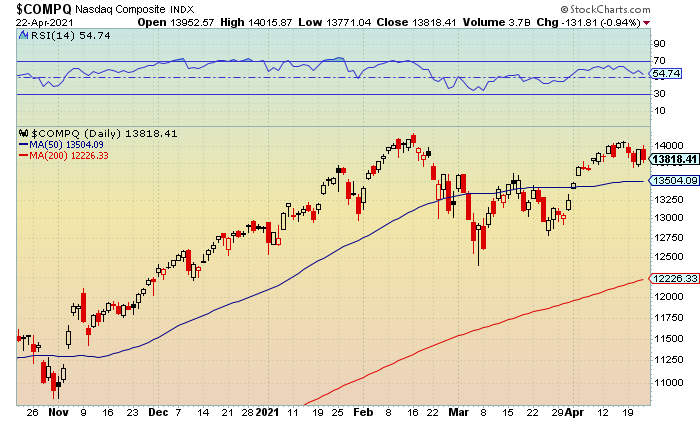
The Nasdaq tapped an afternoon low of 13,771 while closing at 13,818 (-0.9%). Near-term and upper support at 13,800-13,650 was breached but held. A drop below the latter would signal a retest towards 13,500-13,350.
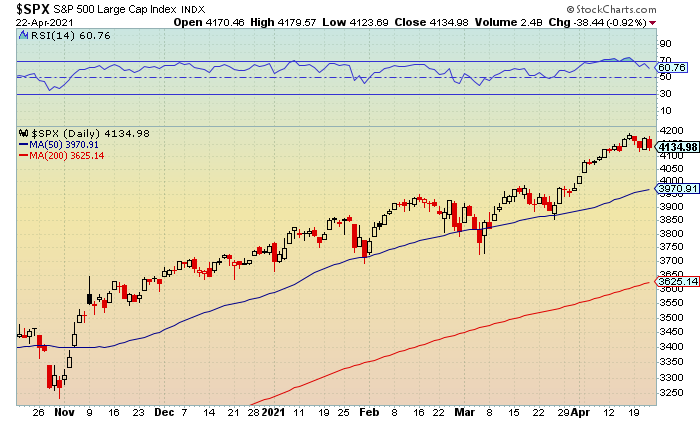
The S&P 500 ended at 4,134 (-0.9%) after testing a low of 4,123. Upper support at 4,125-4,100 was breached but held. A move below the latter would suggest additional weakness towards 4,075-4,050.
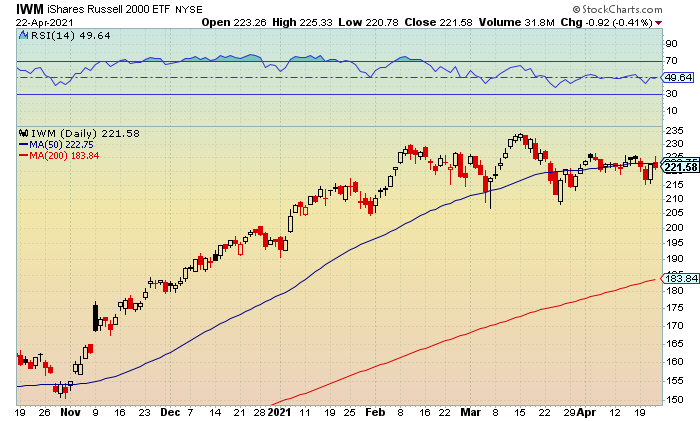
The Russell 2000 finished at 2,232 (-0.3%) with the second half low reaching 2,227. Prior and upper support at 2,225-2,200 was challenged but held. A close below the latter would likely lead to a further pullback towards 2,175-2,150 with Tuesday’s and the monthly low at 2,171. Below is a chart of the IWM.
Market Movers
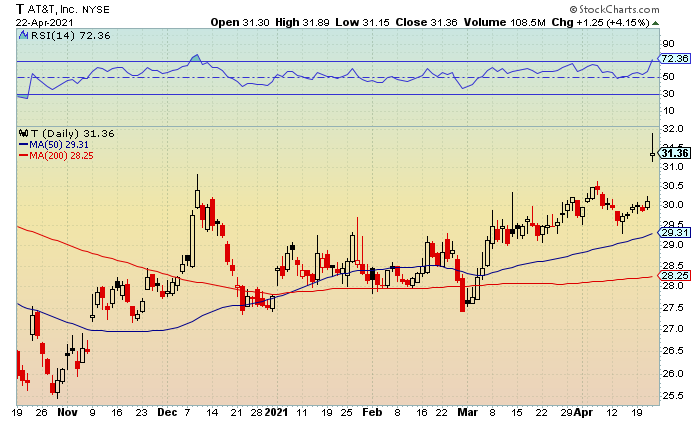
Shares of AT&T (T) rose 4% after topping first-quarter earnings and revenue estimates. The company also reported 2.7 million total domestic HBO Max and HBO subscriber net adds in Q1.
Volatility Index
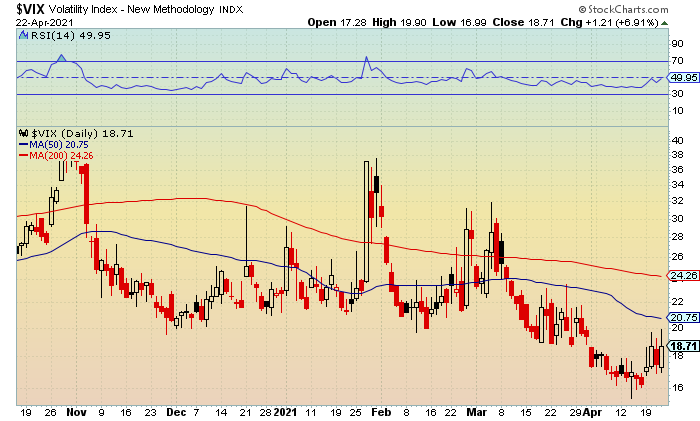
The iPath S&P Vix Short-Term Futures (NYSE: VIX) was up for the third time in four sessions with the midday peak hitting 19.90. Current and lower resistance at 19.50-20 was breached but held. A pop above the latter would signal ongoing strength towards 20.50-21 and the 50-day moving average.
Fresh support is at 18.50-18.
Market Analysis
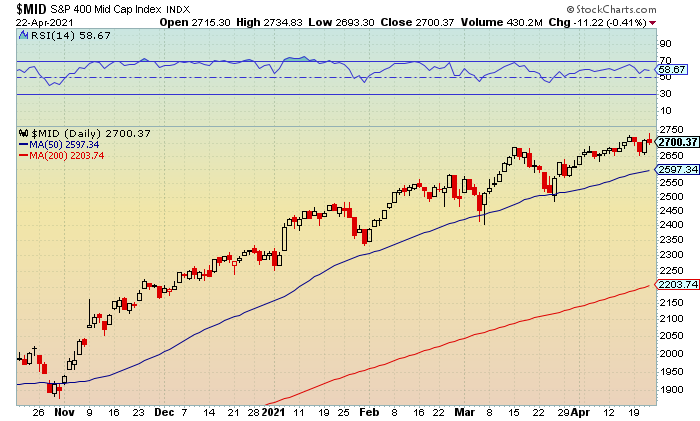
The S&P 400 Mid Cap Index (NYSE: MID) was down for the third time in four sessions despite tagging an all-time opening high of 2,734. Key resistance is at 2,725 was cleared but held.
The fade to 2,693 afterwards breached but held upper support at 2,700-2,675. A move below the latter would indicate additional weakness towards 2,650-2,625.
RSI (relative strength index) is showing signs of rolling over key support at 60 failing to hold. Continued closes below this level would signal weakness towards 55-50. Resistance is at 65-70.
Sector
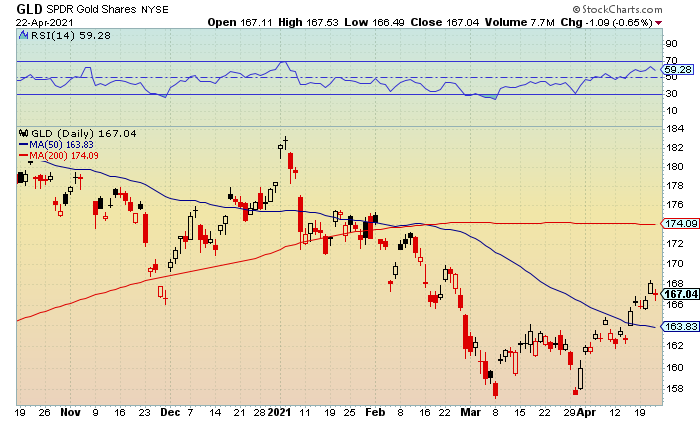
The SPDR Gold Shares (NYSE: GLD) had its two session winning streak snapped following the pullback to $166.49. Near-term and upper support at $166.50-$166 was breached but held. A close below the latter would signal additional downside risk towards $165-$164.50.
Resistance is at $167.50-$168.
RSI is back in a downtrend with key support at 60 failing to hold. There is risk towards 55-50 on continued weakness. Resistance is at 65-70.
Market Outlook
I mentioned the current action would test our patience but the key would be if the VIX could hold 20. Yesterday’s run towards this level was the third time this week it has been tested. Today’s action will be crucial as a sign if next week will continue to be bearish.
It will take a hail Mary for the bulls to win the week as the Nasdaq needs a 234 point rebound to get back to even. The Russell 2000 needs 31 points for a positive week. A higher close, or a 1%+ rally, would indicate a possible strong finish to the month of April.
Options Play List
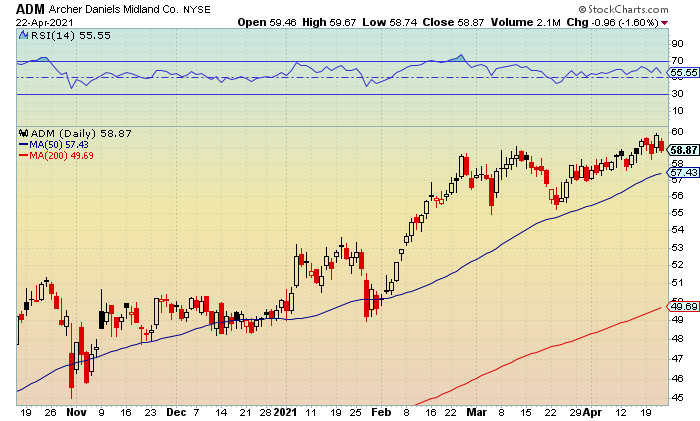
Archer Daniels Midland Company (ADM, $58.87, down $0.96)
ADM May 60 calls (ADM210521C00060000, $1.05, down $0.40)
Entry Price: $1.15 (4/16/2021)
Exit Target: $2.30
Return: -9%
Stop Target: None
Action: Yesterday’s low kissed $58.74 with current and upper support at $59-$58.50 failing to hold. A close below the latter would suggest weakness towards $58-$57.50 and the 50-day moving average. Resistance is at $59.50-$60 with Wednesday’s all-time peak at $59.94.
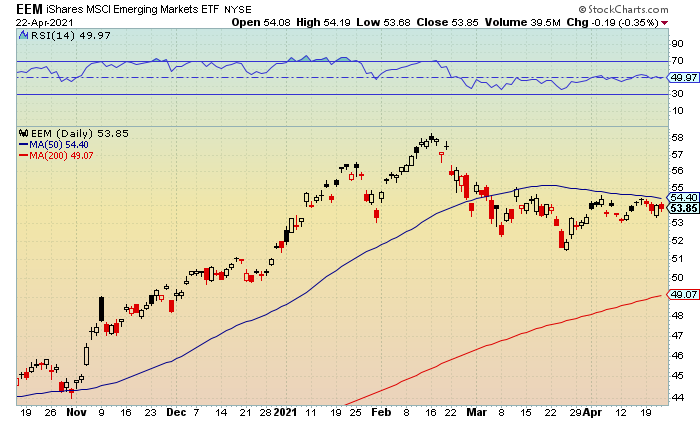
iShares MSCI Emerging Markets ETF (EEM, $53.85, down $0.19)
EEM May 55 calls (EEM210521C00055000, $0.60, unchanged)
Entry Price: $1.00 (4/5/2021)
Exit Target: $2.00
Return: -40%
Stop Target: None
Action: Shares tested a late day high of $54.19 before settling in the red. Lower resistance at $54.25-$54.75 and the 50-day moving average were challenged but held. Support is at $53.50-$53.
Pre-Market Update for 4/22/2021
Bulls Bounce Back
8:00am (EST)
The stock market rebounded on Wednesday despite opening weakness and a major revenue miss from Netflix (NFLX). Specifically, the company reported a profit of $3.16 versus forecasts for a print of $2.68 but revenues of $7.3 billion fell shy of forecasts for nearly $7.4 billion.
Additionally, Netflix reported first-quarter subscriber growth that sharply missed expectations. Despite the news, the majority of other major companies reporting earnings this week have topped expectations and added to the bullish sentiment.
The Russell 2000 led the way higher after trading to an intraday peak of 2,240 before closing at 2,239 (+2.4%). Near-term and lower resistance at 2,225-2,250 was cleared and held. A close above the latter would indicate ongoing strength towards 2,275-2,300. Below is a chart of the IWM.
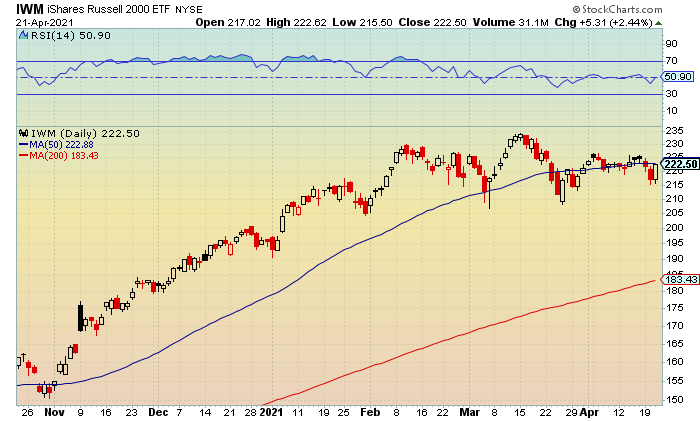
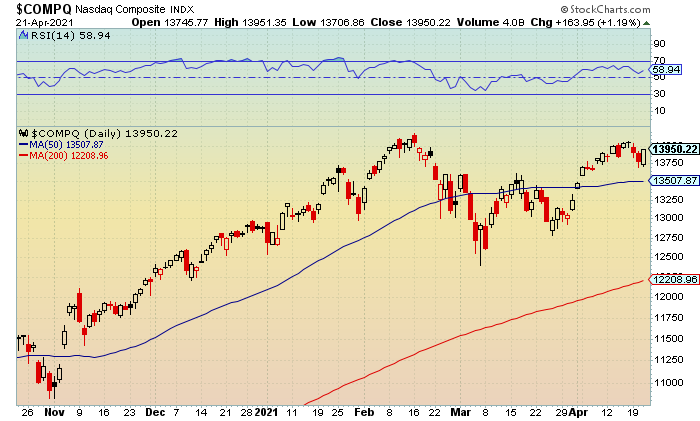
The Nasdaq tapped a second half high of 13,951 before ending at 13,950 (+1.2%). Current and lower resistance at 13,850-14,000 was recovered. A move above the latter would indicate additional strength towards 14,100-14,250 with the mid-February all-time high at 14,175.
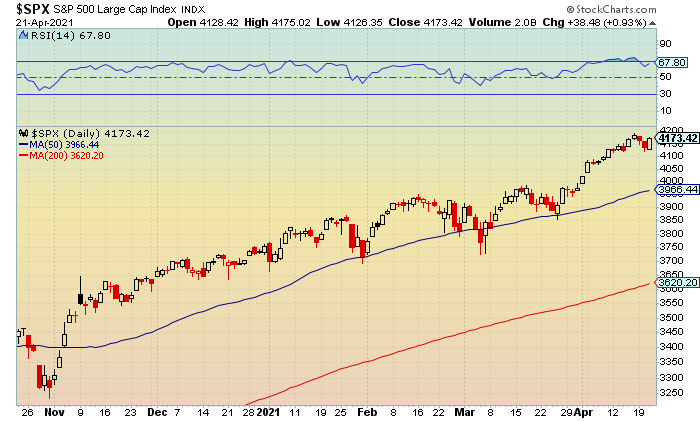
The S&P 500 tested an afternoon high of 4,175 before settling at 4,173 (+0.9%). Prior and lower resistance at 4,175-4,200 was breached but held. A pop the latter and last Friday’s all-time peak at 4,191 would suggest ongoing strength towards 4,225-4,250.
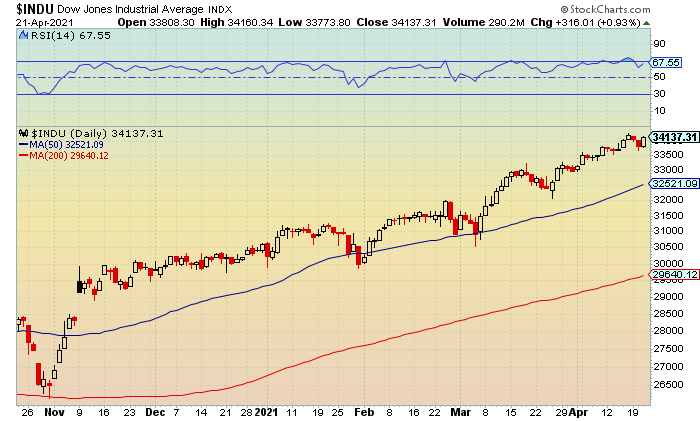
The Dow tagged to a second half high of 34,160 before finishing at 34,137 (+0.9%). Near-term and lower resistance at 34,000-34,250 was recovered. A close above the latter and the recent record top at 34,256 would signal a possible breakout towards 34,500-34,750.
Market Movers
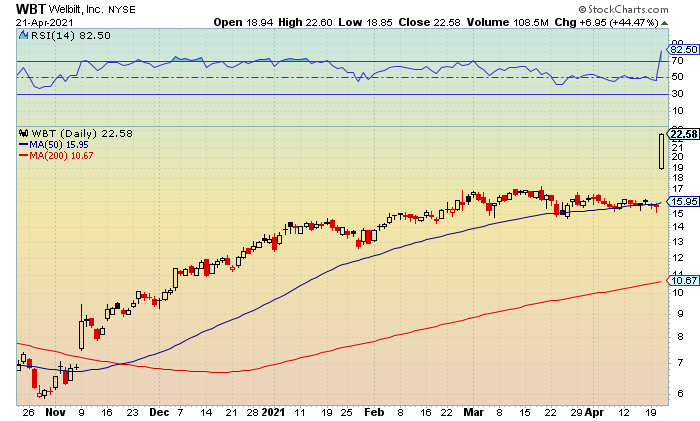
Shares of Welbilt (WBT) zoomed 44% after Middleby (MIDD) said it will acquire the company in an all-stock transaction with a value of $4.3 billion.
Volatility Index
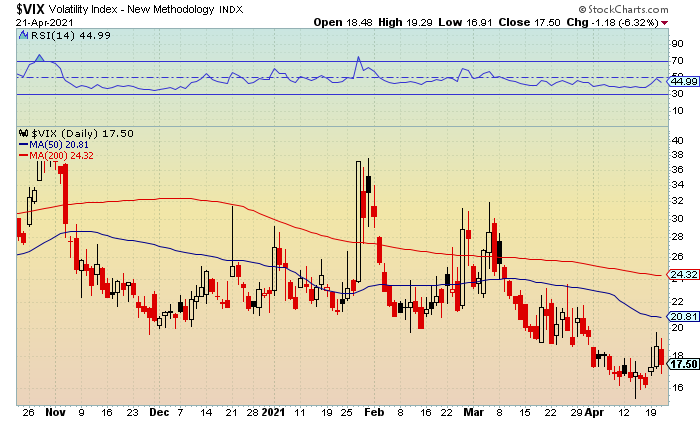
The iPath S&P Vix Short-Term Futures (NYSE: VIX) was down for the first time in three sessions with the intraday low tapping 16.91. Prior and upper support at 17-16.50 was breached but held. A drop below the latter would be a more bullish development for retest towards 16-15.50.
Resistance is at 18.50-19.
Market Analysis
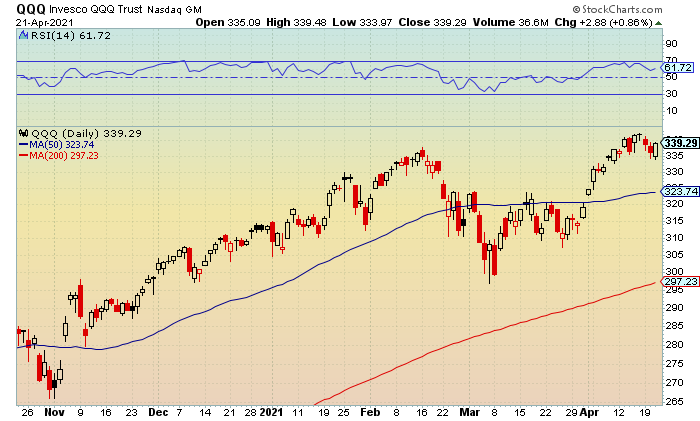
The Invesco QQQ Trust (Nasdaq: QQQ) snapped a two-session slide with the intraday peak reaching $339.48. Current and lower resistance at $339-$339.50 was recovered. A close above the $340 level would indicate another run towards $342-$342.50 with the recent all-time top at $342.23.
Support is at $338-$337.50 followed by $334.50-$334.
RSI (relative strength indicator) is back in a slight uptrend with lower resistance at 60-65 getting cleared and holding. A close below the latter would signal additional strength towards 70 and a level that has been holding since early December. Support is at 55-50.
Sector
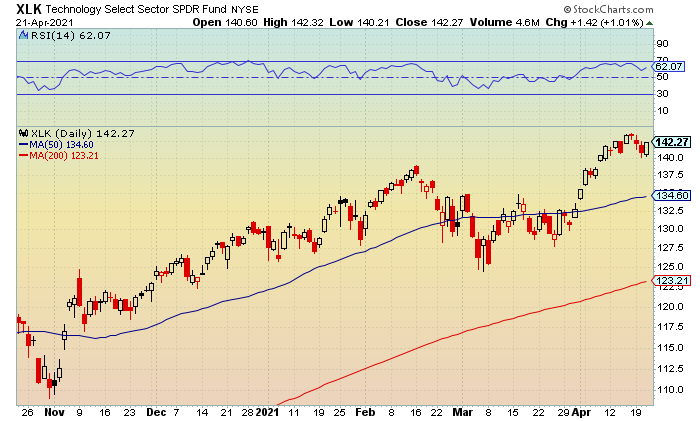
The Technology Select Sector Spider Fund (NYSE: XLK) rose for the first time in four sessions after testing a high of $142.32. Near-term and lower resistance at $142-$142.50 was recovered. A move above the latter would signal additional upside towards $143.50-$144 with the recent record peak at $143.57.
Support is at $142-$141.50 followed by $140.50-$140.
RSI is in a slight uptrend with key support at 60 getting cleared and holding. Continued closes above this level would signal a retest 65-70. Support is at 55-50.
I have updated our current trades so let’s go check the tape.
Options Play List
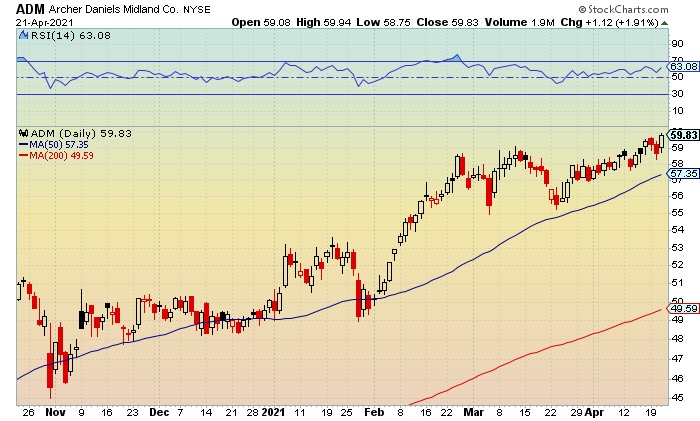
Archer Daniels Midland Company (ADM, $59.83, up $1.12)
ADM May 60 calls (ADM210521C00060000, $1.45, up $0.40)
Entry Price: $1.15 (4/16/2021)
Exit Target: $2.30
Return: 27%
Stop Target: None
Action: Wednesday’s all-time peak reached $59.94 with prior and lower resistance at $59.50-$60 getting cleared and holding. A close above the latter would signal momentum towards $61-$61.50. Support is at $59-$58.50.
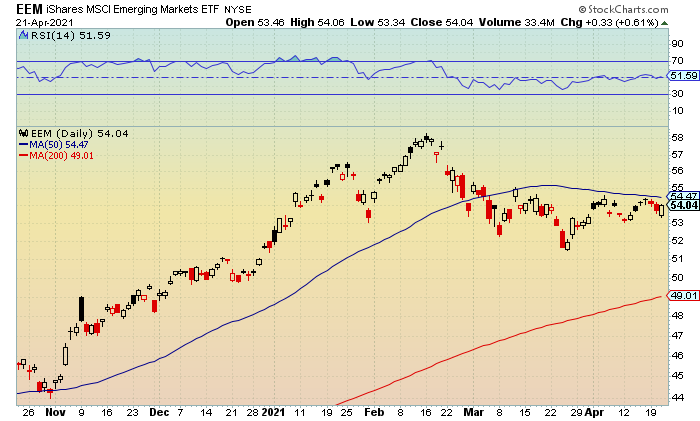
iShares MSCI Emerging Markets ETF (EEM, $54.04, up $0.33)
EEM May 55 calls (EEM210521C00055000, $0.60, unchanged)
Entry Price: $1.00 (4/5/2021)
Exit Target: $2.00
Return: -40%
Stop Target: None
Action: Shares tested a late day high of $54.06 with lower resistance at $54-$54.50 getting cleared and holding. A close above the latter and the 50-day moving average would be a more bullish development for continued upside. Support is at $53.50-$53.
Pre-Market Update for 4/21/2021
Bears Get Second-Straight Win
8:00am (EST)
The stock market showed weakness for the second-straight session amid a resurgence in worries over the coronavirus that have caused nervousness about the global recovery outlook. Profit taking could continue over the near-term despite better-than-expected earnings as sentiment gauges remain extremely bullish, which could be a contrarian warning.
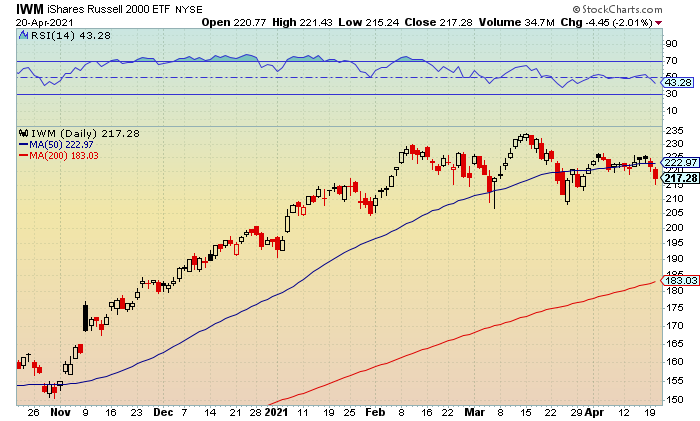
The Russell 2000 tested a first half low of 2,171 before closing at 2,188 (-2%). Current and upper support at 2,175-2,150 was breached but held. A drop below the latter would signal additional weakness towards 2,125-2,100. Below is a chart of the IWM.
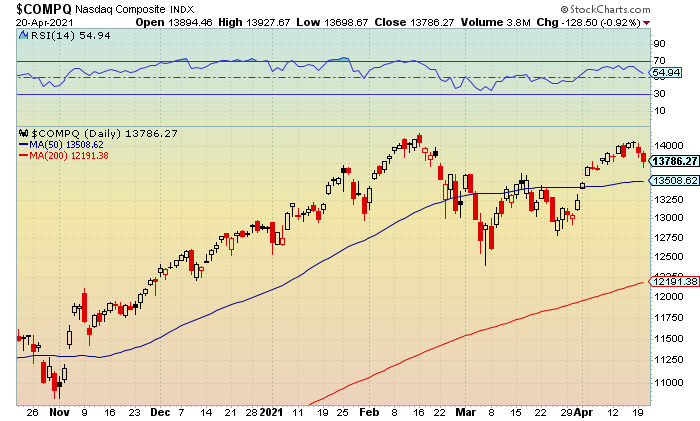
The Nasdaq settled at 13,786 (-0.9%) following the intraday fade to 13,698. Prior and upper support at 13,750-13,500 was tripped but held. A move below the latter and the 50-day moving average would indicate ongoing weakness towards 13,400-13,250.
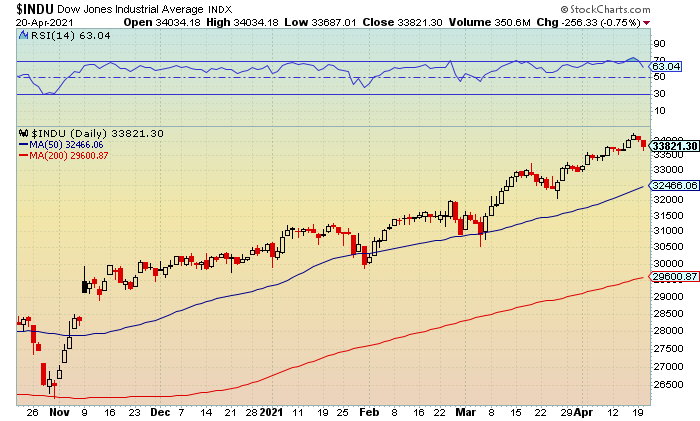
The Dow ended at 33,821 (-0.8%) with the low reaching 33,687. Near-term and upper support at 33,750-33,500 was breached but held. A close below the latter and the 50-day moving average would suggest a retest towards 33,250-33,000.
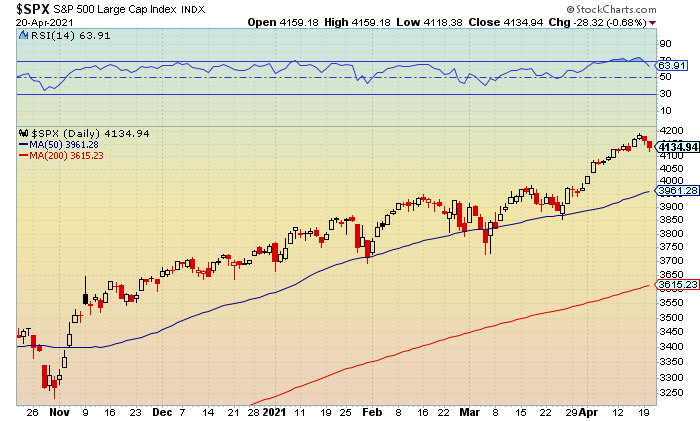
The S&P 500 traded down to 4,118 before finishing at 4,134 (-0.7%). Current and upper support at 4,125-4,100 was clipped but held. A fall below the latter would likely lead to additional weakness towards 4,075-4,050.
Market Movers
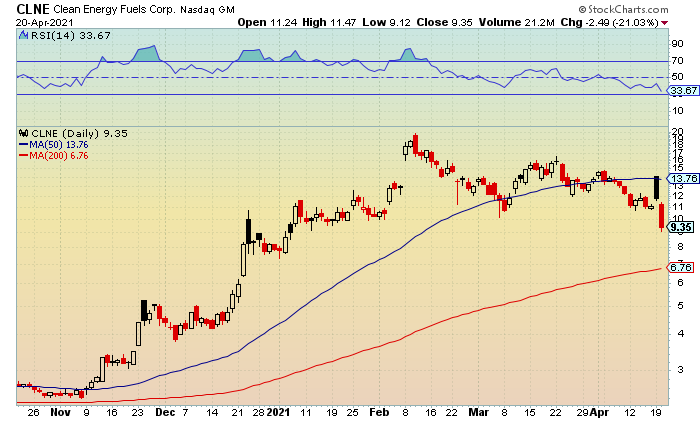
Shares of Clean Energy (CLNE) sank 21% following an analyst downgrade to Underperform from Market Perform without a price target. The company recently announced plans to supply fuel to a modest number of Amazon (AMZN) trucks.
Volatility Index
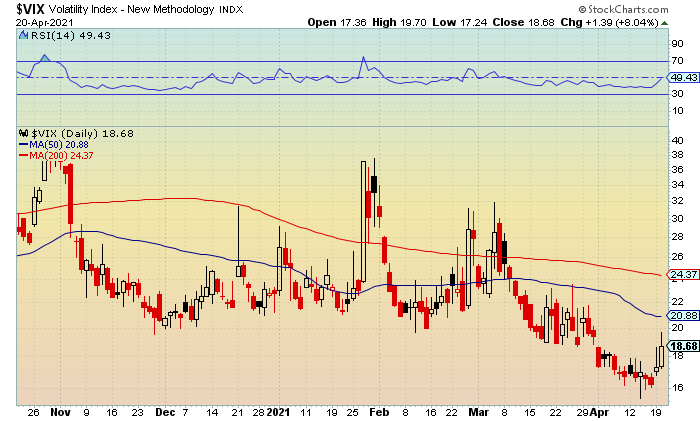
The iPath S&P Vix Short-Term Futures (NYSE: VIX) was up for the second-straight sessions with the intraday peak hitting 19.70. Prior and lower resistance from late March at 19.50-20 was breached but held. A move above 21 and the 50-day moving average would signal additional upside towards 24-24.50.
Fresh support is at 18-17.50.
Market Analysis
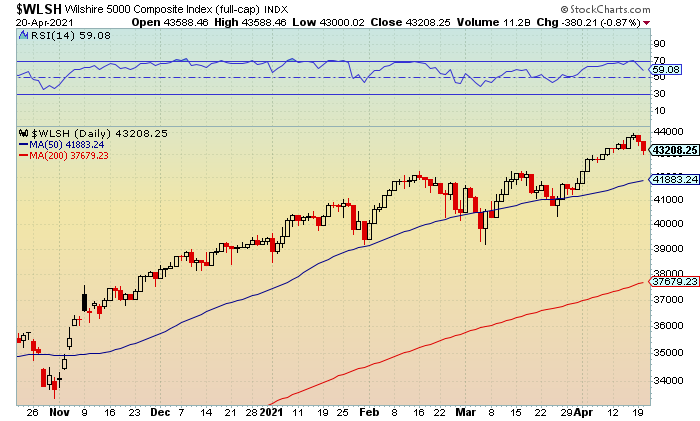
The Wilshire 5000 Composite Index (NYSE: WLSH) was down for the second-straight session with the intraday low tapping 43,000. Fresh and upper supper at 43,250-43,000 failed to hold. A move below the latter would indicate ongoing weakness towards 42,750-42,500.
Resistance is at 43,500-44,000.
RSI (relative strength index) is in an downtrend with key support at 60 failing to hold. Continued closes below this level would suggest weakness towards 55-50. Resistance is at 65-70 with the latter holding since early January.
Sector
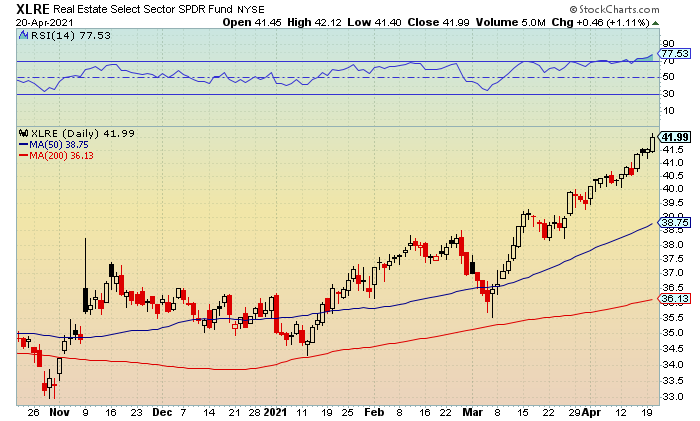
The Real Estate Select Sector SPDR Fund (NYSE: XLRE) extended its winning streak to four-straight sessions with the late day and fresh 52-week peak hitting $42.12. Unchartered territory and lower resistance at $42-$42.50 was cleared but held by a penny. A close above the latter would suggest additional momentum towards $43.50-$44.
New support is at $41.50-$41.
RSI remains in a uptrend with lower resistance at 70-75 getting breached and holding. Continued closes above the latter would indicate upside towards 80 and the overbought peak from February 2020. Support is at 70-65.
Market Outlook
I said coming into April that it was historically a bullish month for the market. I also mentioned there might be some mid-month weakness given the normal tax deadline. While this year’s tax deadline was pushed out into mid-May, the steady rise over the past few weeks led to some extremely overbought market conditions.
The Russell 2000 failed to hold its 50-day moving average to start the week, and it appears the Nasdaq could be next on continued weakness. The S&P 500 and Dow are roughly 4% away from testing their 50-day moving averages. It wouldn’t be shocking to see them come into play and there is likely a good chance they hold. If so, it would be healthy for the overall market and possibly entice traders to “buy the dip”.
The key this week will be if volatility and the VIX can hold the 20-21 area and the 50-day moving average. This technical indicator had been in a defined downtrend throughout the month but is showing signs of leveling out. If these levels are cleared, then some panic selling could come into play.
The good news is the portfolio is light with only two open trades and the May options have a month before expiration. We were able to close another winning trade for the year to get the Track Record to 16-4 and represents an 80% win rate. However, having positions that are down can be stressful but this can be lessened by looking at the bigger picture.
While it is tempting to look at bearish setups, I don’t believe that time is now until the technical outlook worsens. At some point this year, there will be a nasty correction and a chance to make money with put options. However, let’s see how the rest of the week, and month, plays out before giving up on the bulls and riding with the bears.
Options Play List
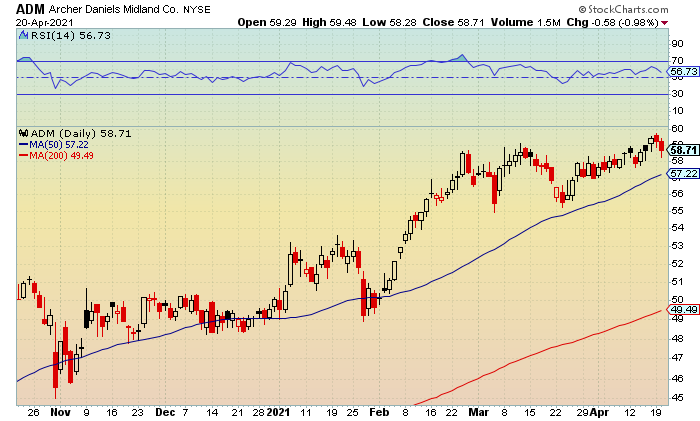
Archer Daniels Midland Company (ADM, $58.71, down $0.58)
ADM May 60 calls (ADM210521C00060000, $1.05, down $0.15)
Entry Price: $1.15 (4/16/2021)
Exit Target: $2.30
Return: -9%
Stop Target: None
Action: Shares tested a low of $58.28 with prior and upper support at $58.50-$58 getting breached but holding. I would like to see the latter hold on continued weakness. Lowered resistance is at $59-$59.50.
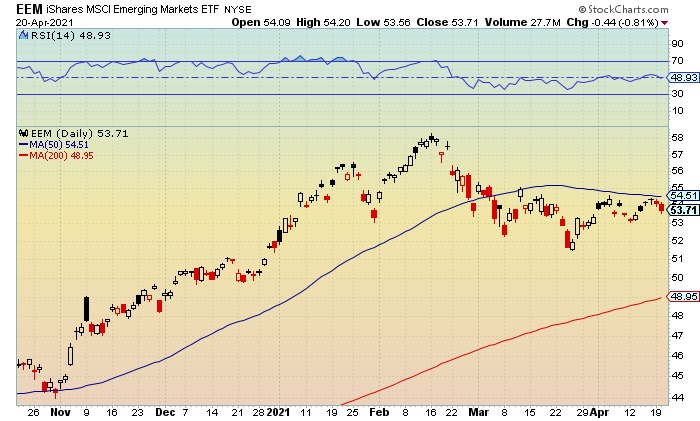
iShares MSCI Emerging Markets ETF (EEM, $53.71, down $0.44)
EEM May 55 calls (EEM210521C00055000, $0.60, down $0.15)
Entry Price: $1.00 (4/5/2021)
Exit Target: $2.00
Return: -40%
Stop Target: None
Action: Tuesday’s low tapped $53.56 with prior and upper support at $53.50-$53 getting challenged but holding. A close below the latter would be a slightly bearish development. Resistance is at $54-$54.50 and the 50-day moving average.
Pre-Market Update for 4/20/2021
Bears Get Rare April Win
8:00am (EST)
The stock market retreated from last week’s record highs after trading in negative territory throughout Monday’s session. Some of the nervousness was attributed to a rise in the 10-year Treasury yield which topped 1.6% and the weekend plunge in Bitcoin.
Specifically, Bitcoin sank as much as 15% on Sunday, and other major coins like Ether also tumbled. Additionally, a busy week for first-quarter earnings caused a slight pause in the action as investors await the next round of results from a number of major companies.
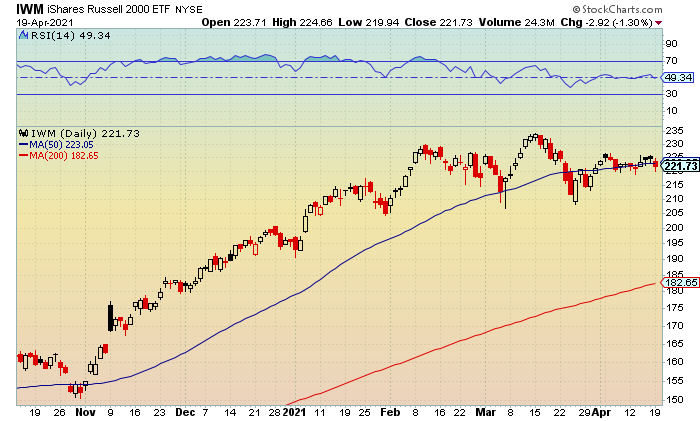
The Russell 2000 finished at 2,232 (-1.6%) and back below its 50-day moving average with the morning low reaching 2,219. Prior and upper support at 2,225-2,200 was breached but held. A close below the latter would likely lead to a further pullback towards 2,175-2,150. Below is a chart of the IWM.
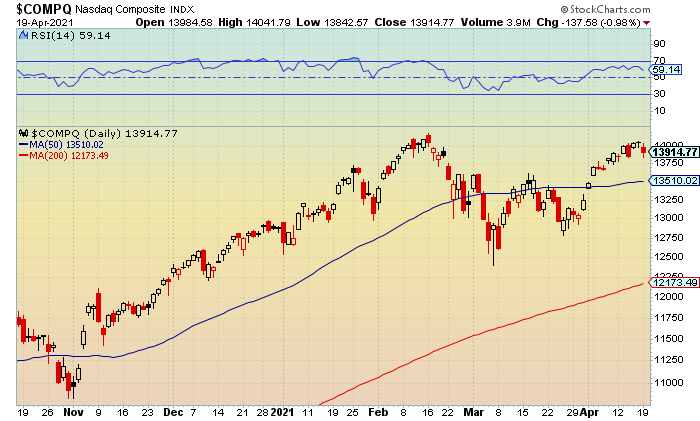
The Nasdaq hit an afternoon low of 13,842 while closing at 13,914 (1%). Near-term and upper support at 13,900-13,750 was tripped but held. A drop below the latter would signal a retest towards 13,650-13,500.
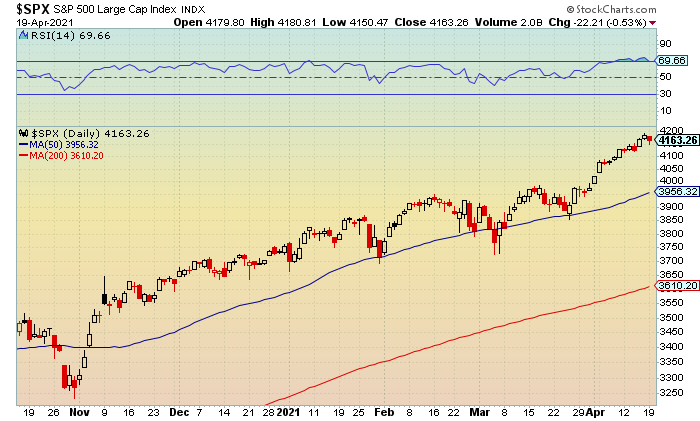
The S&P 500 ended at 4,163 (-0.5%) after testing a low of 4,150. Fresh and upper support at 4,150-4,125 was breached but held. A move below the latter would suggest additional weakness towards 4,100-4,075.
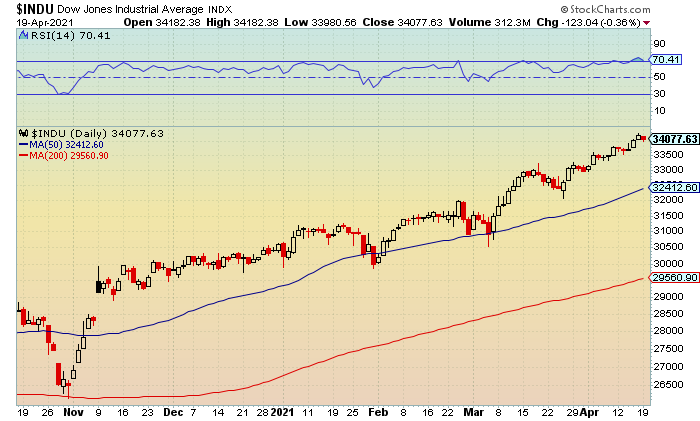
The Dow tapped an intraday low of 33,980 before settling at 34,077 (-0.4%). New and upper support at 34,000-33,750 was clipped but held. A close below the latter would indicate a further fade towards 33,500-33,250.
Market Movers
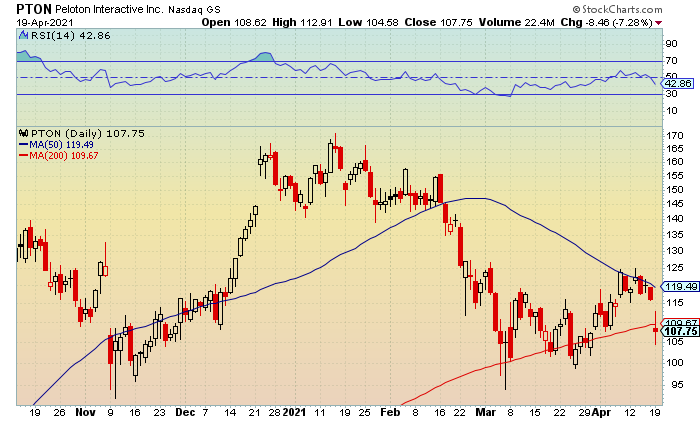
Shares of Peloton (PTON) fell 7% after the U.S. Consumer Product Safety Commission issued release over the weekend about the danger of the Peloton Tread+ exercise machine following multiple incidents of small children and a pet being injured.
Volatility Index
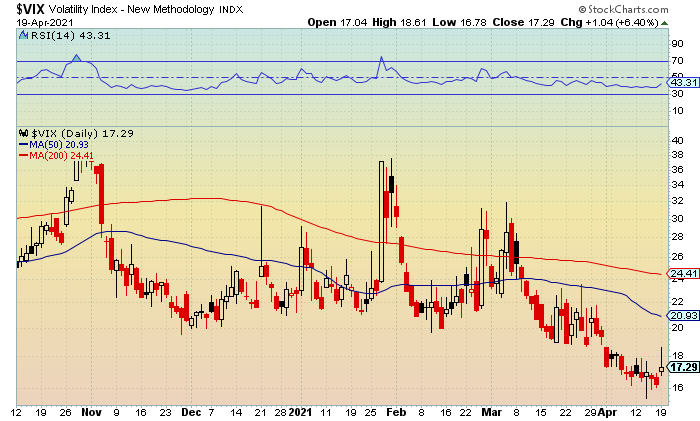
The iPath S&P Vix Short-Term Futures (NYSE: VIX) rose for the first time in three sessions following the intraday bounce to 18.61. Prior and lower resistance from the start of the month at 18.50-19 was breached but held. A move above the latter would indicate additional strength towards 20-20.50 and the 50-day moving average.
Support is at 17.50-17.
Market Analysis
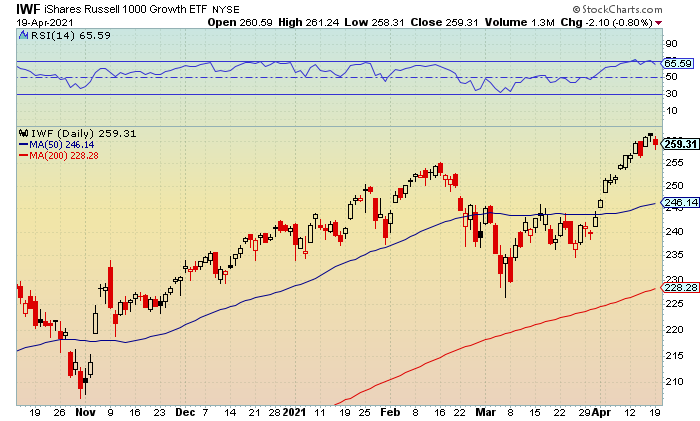
The iShares Russell Growth 1000 ETF (NYSE: IWF) was down for just the second rime in 13 sessions with the first half low tapping $258.31. Fresh and upper support at $258.50-$258 was clipped but held. A move below the latter would suggest further risk towards $257-$256.50.
Resistance is at $261-$271.50 with last Friday’s all-time peak at $261.80.
RSI is in a downtrend with upper support at 65-60 holding. A close below the latter would suggest additional weakness towards 55-50 and levels from late March. Resistance is at 70-75.
Sector
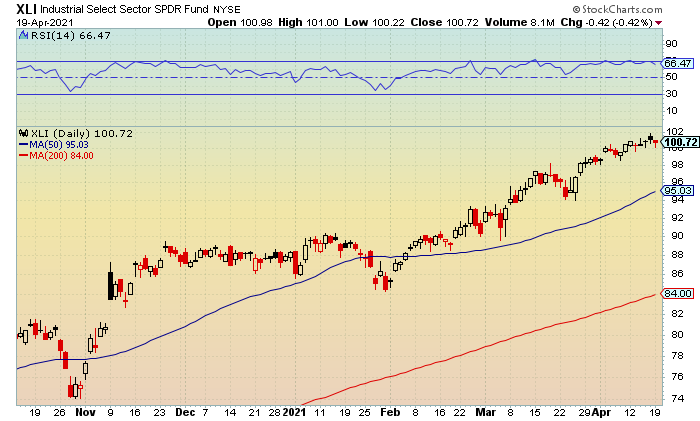
The Industrials Select Sector SPDR Fund (NYSE: XLI) had its three session winning streak snapped a following the intraday pullback to $100.22. New and upper support at $100.50-$100 was breached but held. A close below the latter would indicate a retest towards $99-$98.50.
Resistance is at $101-$101.50 with last Friday’s record high at $101.80.
RSI is back in a slight downtrend with upper support at 65-60 holding. A close below the latter would indicate risk towards 55-50 in play. Key resistance is at 70 and a level that has been golding since early September.
Market Outlook
Monday’s pullback was not too surprising given the slightly overbought levels I have been mentioning. However, the surge in volatility past 18 needs to be monitored. I still believe higher highs for the major indexes are in store for the rest of the month, and possibly into May, but a close above 20 would be the first sign to lighten up on bullish positions.
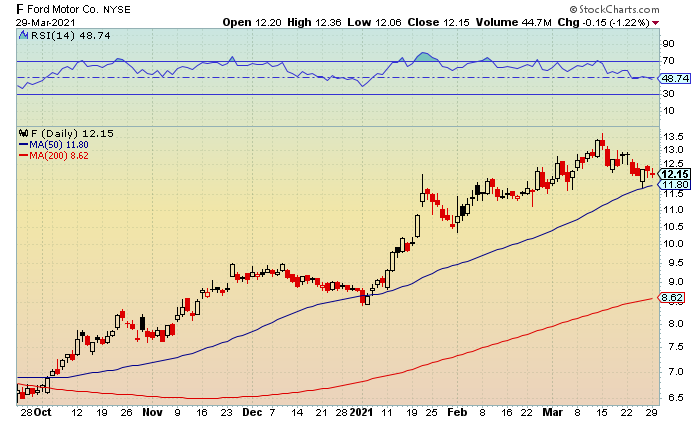
Our current positions held up well on Monday and there are possibly one or two more new trades that I have on my Watch List for this week. One of them is Ford (F) if shares fall below $12 and hold the $11.75-$11.50 area. The close below the 50-day moving average on Monday is still signaling some downside action so we need to be a tad patient before possibly taking action.
Options Play List
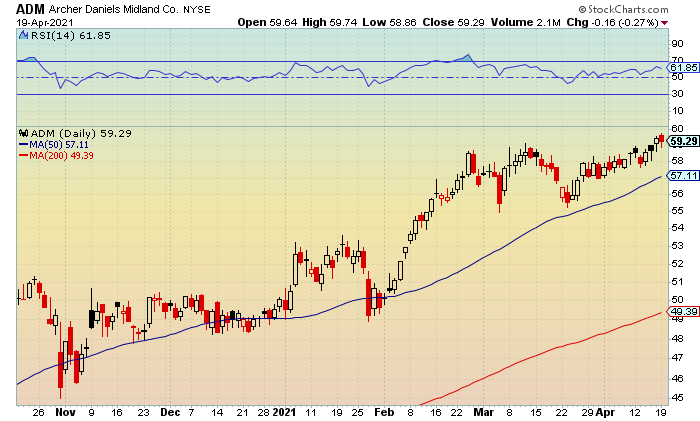
Archer Daniels Midland Company (ADM, $59.29, down $0.16)
ADM May 60 calls (ADM210521C00060000, $1.20, down $0.10)
Entry Price: $1.15 (4/16/2021)
Exit Target: $2.30
Return: 4%
Stop Target: None
Action: Monday’s low tapped $58.86 with upper support at $59-$58.50 getting breached but holding. Resistance is at $59.50-$60.
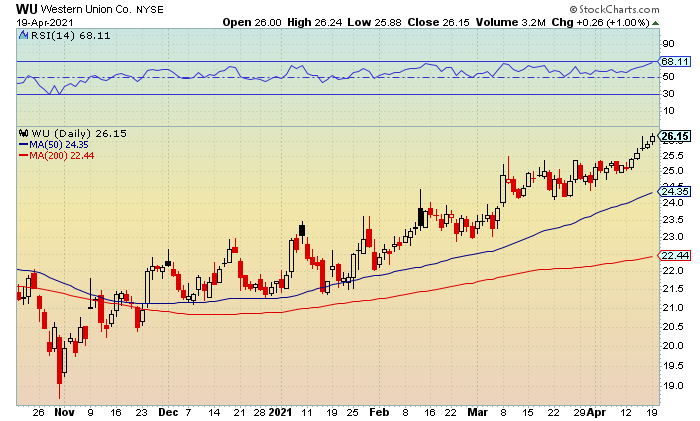
Western Union (WU, $26.15, up $0.26)
WU May 26 calls (WU210521C00026000, $0.90, up $0.10)
Entry Price: $0.60 (4/7/2021)
Exit Target: $1.20
Return: 50%
Stop Target: 66 cents, raise to 72 cents (Stop Limit)
Action: Raise the Stop Limit from 66 cents to 72 cents.
Shares tagged a fresh 52-week high of $26.24 with current and lower resistance at $26-$26.25 getting cleared and holding. A close above the latter and would suggest continued strength towards $26.50-$26.75. Rising support is at $25.75-$25.50.
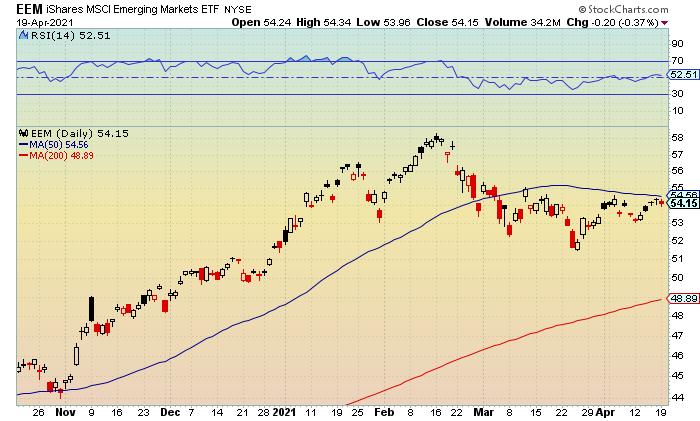
iShares MSCI Emerging Markets ETF (EEM, $54.15, down $0.20)
EEM May 55 calls (EEM210521C00055000, $0.70, down $0.10)
Entry Price: $1.00 (4/5/2021)
Exit Target: $2.00
Return: -30%
Stop Target: None
Action: Shares traded down to $53.96 with upper support at $54-$53.50 getting tripped but holding. Resistance is at $54.50-$55 and the 50-day moving average.
Pre-Market Update for 4/19/2021
Market Stays Hot for the Fourth-Straight Week
8:00am (EST)
The stock market closed higher on Friday following another record-setting rally, fueled by stronger-than-expected economic data and earnings. Specifically, housing starts rose 19.4% to a 1.74 million rate in March, while March building permits rose 2.7% to a 1.77 million rate. Additionally, the University of Michigan consumer sentiment survey reading increased 1.6 points to 86.5 in the preliminary April report.
Bank earnings continue to shine as Morgan Stanley (MS) reported better-than-expected numbers for the first quarter, with the company saying on its conference call that the quarter was marked by numerous performance records. The weekly gains were the fourth-straight for the overall market.
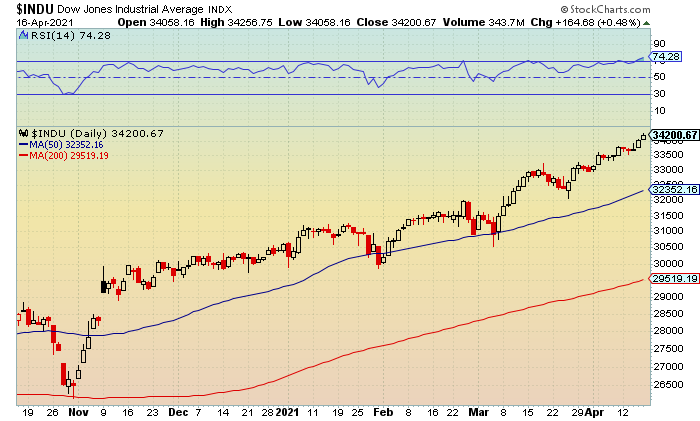
The Dow traded to an opening all-time high of 34,256 while finishing at 34,200 (+0.5%). Unchartered territory and lower resistance at 34,250-33,500 was cleared but held. A move above the latter would signal ongoing strength towards 34,750-35,000.
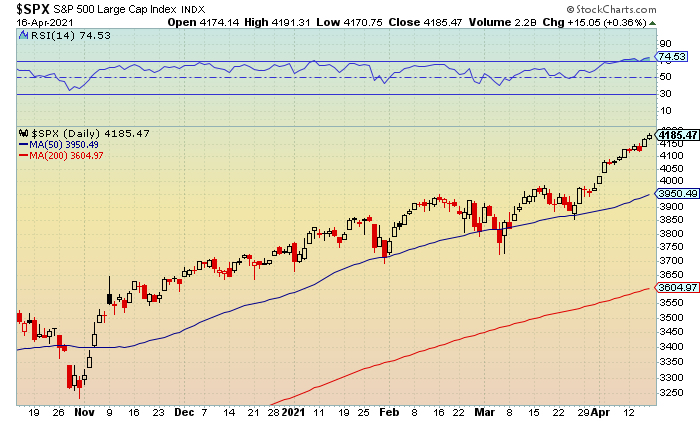
The S&P 500 closed at 4,185 (+0.4%) after reaching a record peak of 4,191 ahead of the final bell. Fresh and lower resistance at 4,175-4,200 was breached and held. A pop above the latter would indicate upside towards 4,225-4,250.
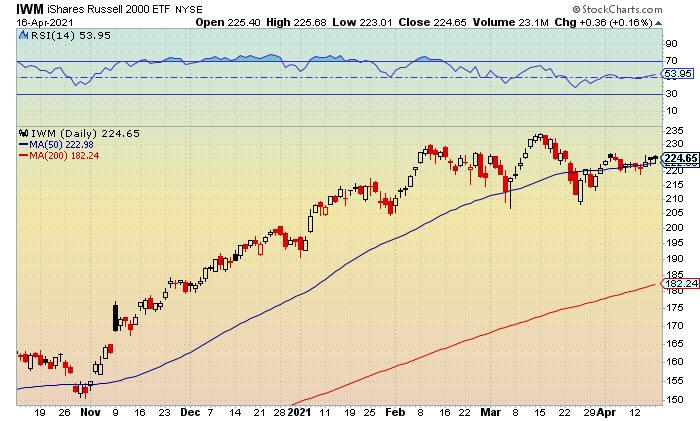
The Russell 2000 settled at 2,262 with the morning high tapping 2,273 (+0.3%). Near-term and lower resistance at 2,275-2,300 was challenged but held. A move above the latter would suggest additional strength towards 2,325-2,350 with the all-time top from mid-March at 2,360. Below is a chart of the IWM.
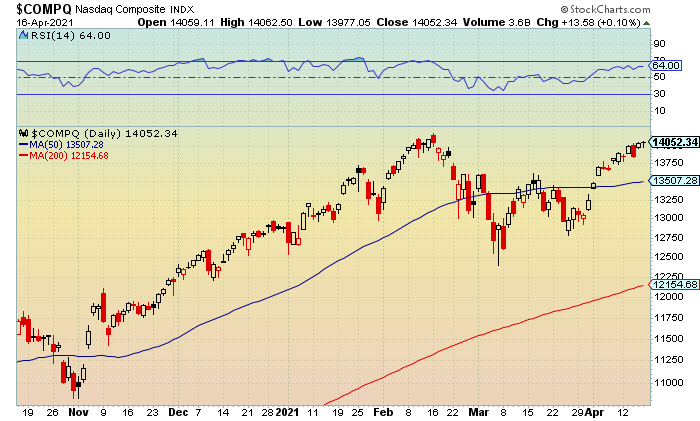
The Nasdaq ended at 14,052 (+0.1%) with the late day peak hitting 14,062. Prior and lower resistance from early February at 14,050-14,150 was cleared and held. A close above the latter and the record high at 14,175 would likely lead to a breakout towards 14,250-14,400.
Market Movers
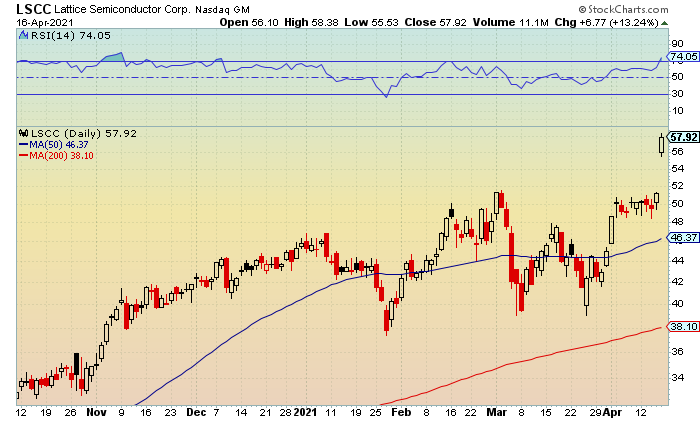
Shares of Lattice Semiconductor (LSCC) jumped 13% following news it will be added to the S&P 400.
Volatility Index
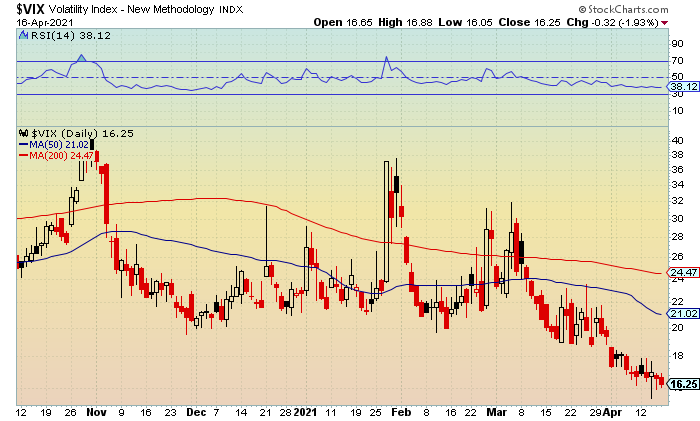
The iPath S&P Vix Short-Term Futures (NYSE: VIX) fell for second-straight session with the low reaching 16.05. Current and upper support at 16-15.50 was challenged but held. A move below the latter would signal a further fade towards 15-14.50.
Resistance at 17-17.50 with a close above 18 being a slightly bearish development.
Market Analysis
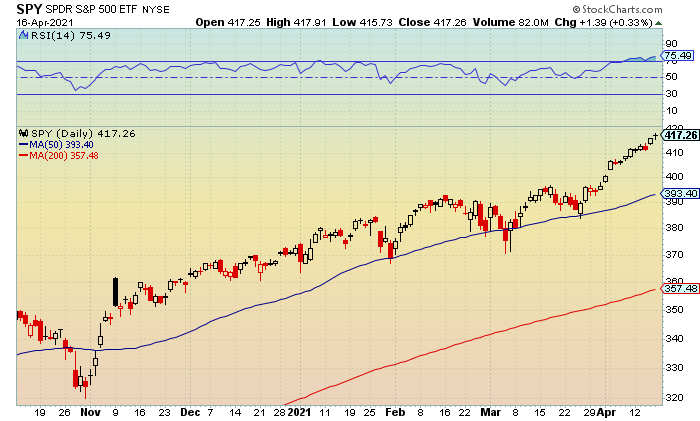
The SPDR S&P 500 ETF (NYSE: SPY) was up for the seventh time in eight sessions after trading to a record high of $417.91. Unchartered territory and lower resistance at $417.50-$418 was cleared but held. A close above the latter would indicate additional upside towards $419.50-$420.
Near-term support is at $416-$415.50 followed by $414-$413.50.
RSI (relative strength index) remains in a slight uptrend with key resistance at 75 getting cleared and holding. Continued closes above this level would suggest a run towards 80 and overbought territory from late August/ early September. Support is at 70.
Sector
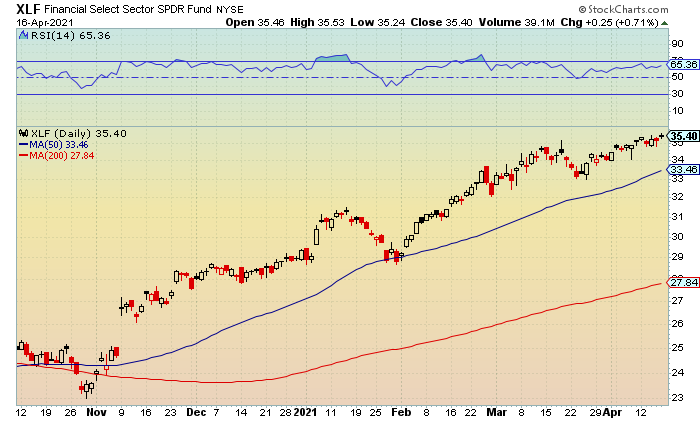
The Financial Select Sector Spider Fund (NYSE: XLF) rebounded after trading to an all-time peak of $35.53. Fresh and lower resistance at $35.50-$35.75 was tripped but held. A close above the latter would indicate continued strength towards $36.25-$36.50.
Support is at $35-$34.75.
RSI is curling higher with lower resistance at 65-70 getting recovered. A close above the latter would suggest upside towards 75-80 and the late February highs. Support is at 60-55.
Options Play List
Archer Daniels Midland Company (ADM, $59.45, up $0.78)
ADM May 60 calls (ADM210521C00060000, $1.30, up $0.30)
Entry Price: $1.15 (4/16/2021)
Exit Target: $2.30
Return: 13%
Stop Target: None
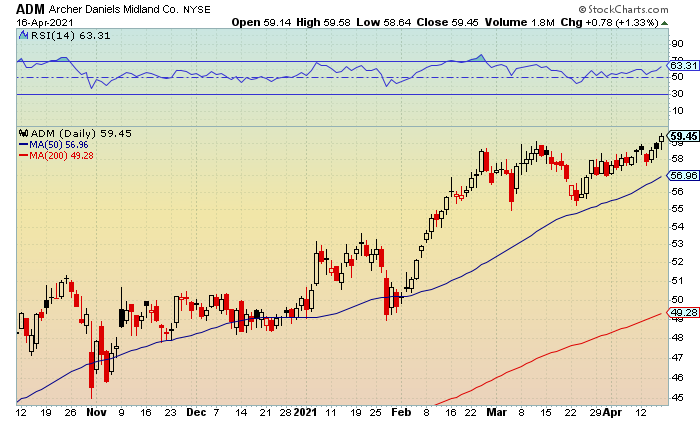
Action: Friday’s all-time peak reached $59.58 with fresh and lower resistance at $59.50-$60 getting cleared but holding. A close above the latter could lead to a breakout towards $61.50-$62. Support is at $59-$58.50. Earnings are due out on April 27th.
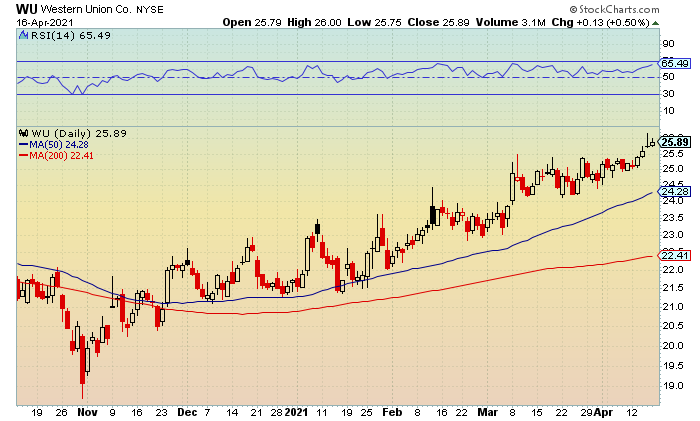
Western Union (WU, $25.89, up $0.13)
WU May 26 calls (WU210521C00026000, $0.80, up $0.05)
Entry Price: $0.60 (4/7/2021)
Exit Target: $1.20
Return: 33%
Stop Target: 62 cents, raise to 66 cents (Stop Limit)
Action: Raise the Stop Limit from 62 cents to 66 cents.
Shares tested a high of $26 with current and lower resistance at $26-$26.25 getting breached but holding. A close above the latter and Thursday’s 52-week high at $26.16 would suggest continued strength towards $26.50-$26.75. Support is at $25.75-$25.50. Earnings are due out the first week of May.
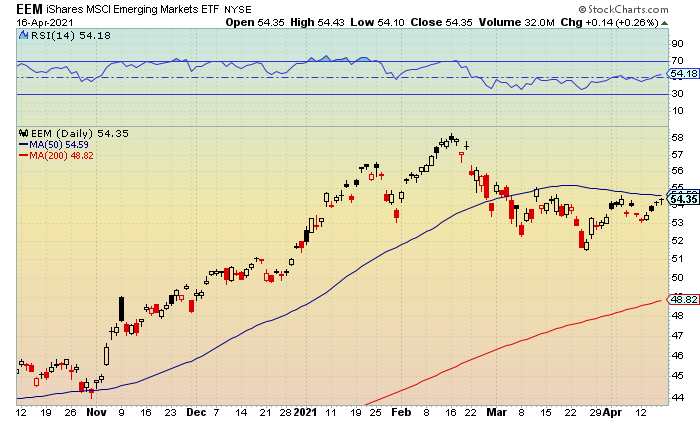
iShares MSCI Emerging Markets ETF (EEM, $54.35, up $0.14)
EEM May 55 calls (EEM210521C00055000, $0.80, up $0.05)
Entry Price: $1.00 (4/5/2021)
Exit Target: $2.00
Return: -20%
Stop Target: None
Action: Friday’s peak reached $54.43 with near-term and lower resistance is at $54.25-$54.75 getting cleared and holding. A close above the latter and the 50-day moving average would be a bullish development for a run towards $55.50-$56. Support is at $54-$53.50.
Pre-Market Update for 4/16/2021
Bulls Continue to Push Record Highs
8:00am (EST)
The stock market showed continued strength on Thursday as encouraging economic news and better-than-expected earnings pushed the major indexes towards new all-time highs and prior resistance levels. Specifically, a much stronger than expected report on consumer spending and a sharp improvement in the number of new jobless claims fueled bullish sentiment.
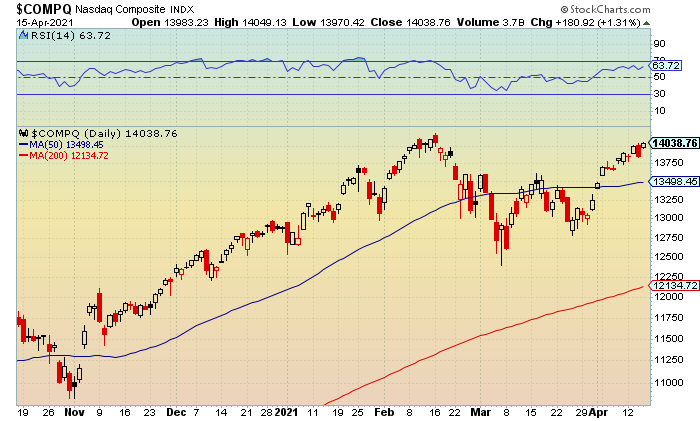
The Nasdaq tested a late day peak of 14,049 before ending at 14,038 (+1.3%). Prior and lower resistance from early February at 14,000-14,150 was recovered. A close above the latter and the all-time high at 14,175 would indicate additional strength towards 14,200-14,350.
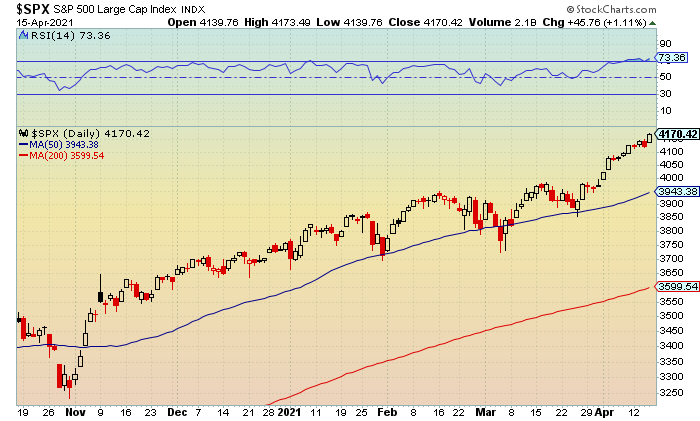
The S&P 500 tapped another record high of 4,173 before settling at 4,170 (+1.1%). Fresh and lower resistance at 4,150-4,175 was cleared and held. A close the latter would suggest ongoing momentum towards 4,200-4,225.
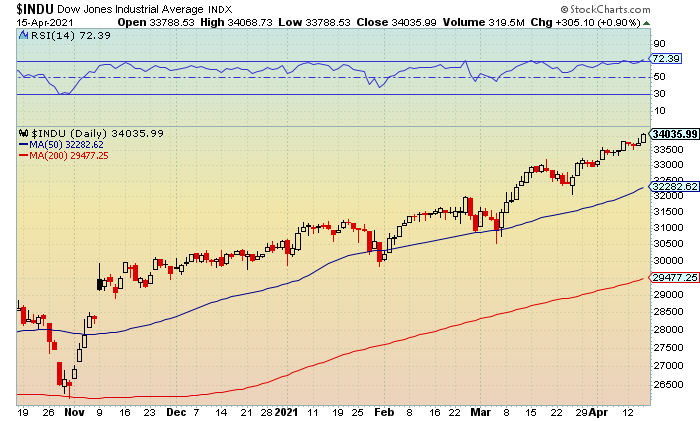
The Dow traded to a new all-time high of 34,068 before finishing at 34,035 (+0.9%). Unchartered territory and lower resistance at 34,000-34,250 was breached and held. A pop above the latter would signal additional upside towards 34,250-34,500.
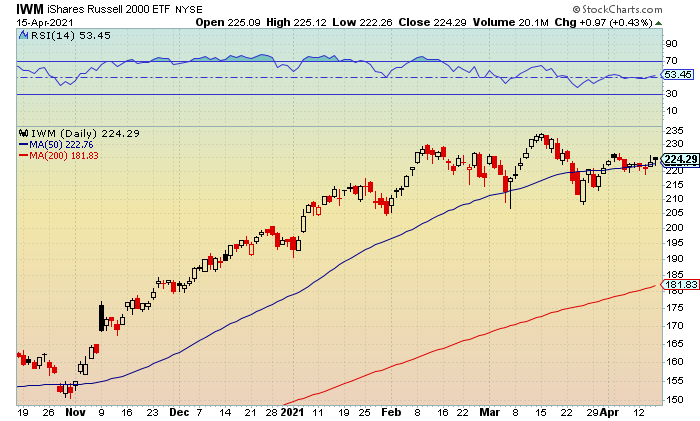
The Russell 2000 tagged an opening high of 2,264 before closing at 2,255 (+0.3%). Near-term and lower resistance at 2,250-2,275 was cleared and held. A close above the latter would indicate ongoing strength towards 2,300-2,325 with the mid-March record peak at 2,360. Below is a chart of the IWM.
Market Movers
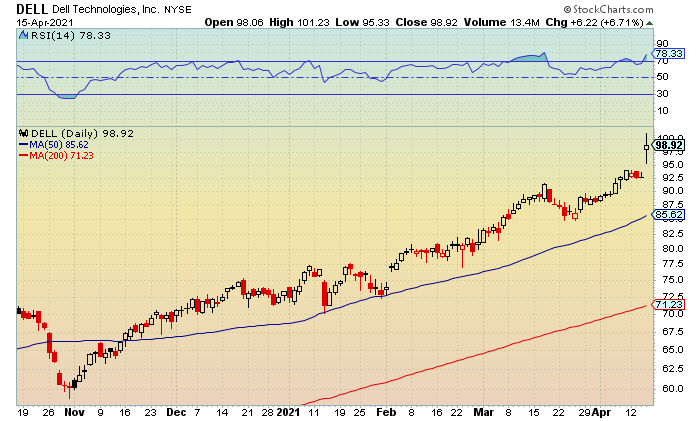
Shares of Dell Technologies (DELL) added nearly 7%% after announcing an agreement on the planned spin-off of its 81% equity ownership interest in VMware (VMW). At the transaction closing, VMware will distribute a special cash dividend of $11.5-$12 billion to all VMware shareholders, including Dell Technologies. Based on the transaction, Dell Technologies would receive approximately $9.3-$9.7 billion and intends to use the net proceeds to pay down debt.
Volatility Index
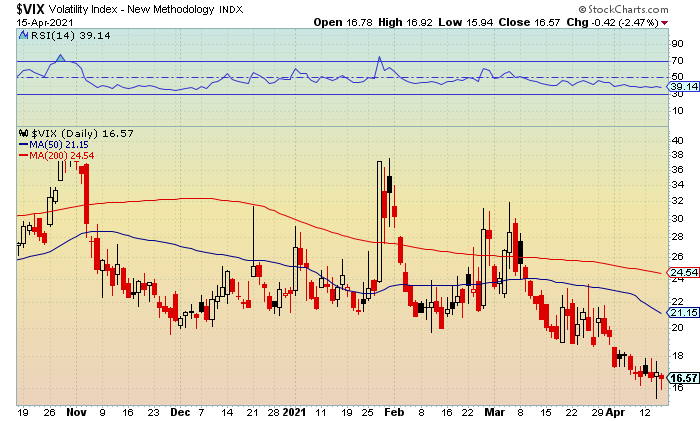
The iPath S&P Vix Short-Term Futures (NYSE: VIX) was down for the second time in three sessions after testing an intraday low of 15.94. Near-term and upper support at 16-15.50 was breached but held. A close below the latter would suggest weakness towards 15-14.50.
Resistance at 17-17.50 with a close above 18 being a slightly bearish signal.
Market Analysis
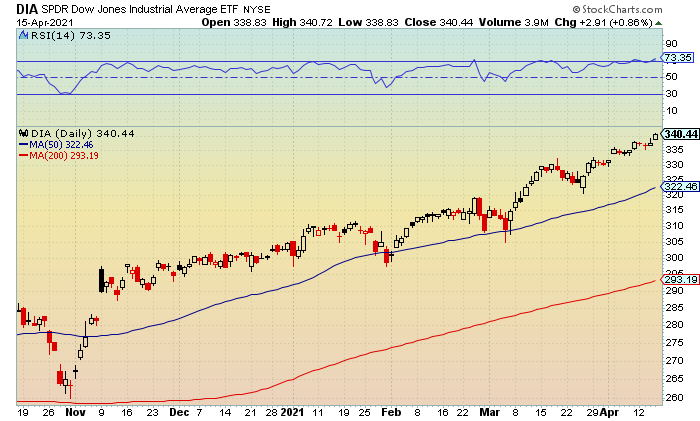
The Spiders Dow Jones Industrial Average ETF (NYSE: DIA) was up for the second-straight session with the afternoon all-time peak reaching $340.72. Unchartered territory and lower resistance at $340.50-$341 was tripped but held. A close above the latter would signal ongoing strength towards the $342.50-$343 area.
Slightly rising support is at $339-$338.50 followed by $337-$336.50.
RSI is in a slight uptrend with key resistance at 75 holding. A move above this level would indicate additional upside towards 80 and prior peak from June 2020. Support is at 70-65.
Sector
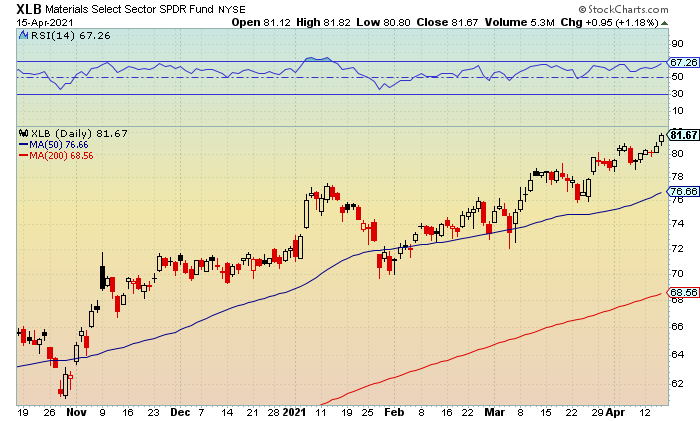
The Materials Select Sector Spider Fund (NYSE: XLB) was also up for the second-straight session and for the fifth time in six with the intraday record high hitting $81.82. Fresh and lower resistance at $81.50-$82 was breached and held. A close above the latter would indicate momentum towards $83-$83.50.
Support is at $81-$80.50 followed by $79.50-$79.
RSI is in an uptrend with lower resistance at 65-70 getting cleared and holding. A close above the latter would suggest further upside towards 75 and the high from early January. Support is at 60-55.
Market Outlook
A closer look at the major indexes are showing slightly overbought levels in the Dow and S&P 500 with relative strength above 70 for both. The Nasdaq and the Russell 2000 still have room to go so I would expect them to outperform over the near-term.
As far as our current trades, I still like them but have made an adjustment to Western Union. As far as new action, I like Archer-Daniels-Midland Company (ADM) and could have an update on getting in today or on Monday as shares could be on the verge of a breakout.
Options Play List
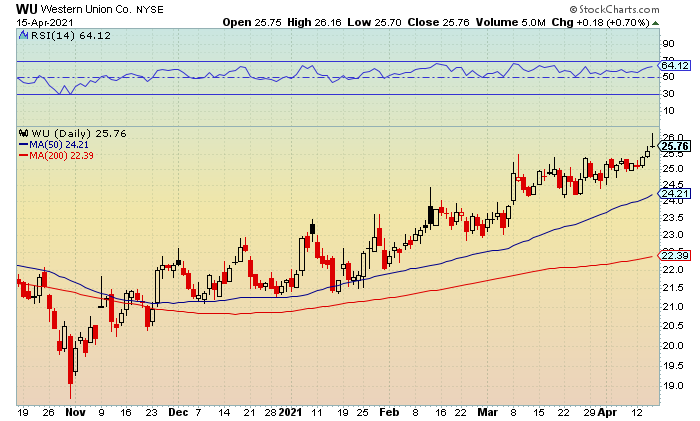
Western Union (WU, $25.76, up $0.18)
WU May 26 calls (WU210521C00026000, $0.75, up $0.05)
Entry Price: $0.60 (4/7/2021)
Exit Target: $1.20
Return: 25%
Stop Target: 62 cents (Stop Limit)
Action: Set an initial Stop Limit at 62 cents to start protecting profits and to avoid a loss.
Shares traded to another fresh 52-week high of $26.16 with the options reaching a peak of 96 cents. Longer-term and lower resistance at $26-$26.25 was cleared but held. A close above the latter would signal continued upside towards $26.50-$26.75. Rising support is at $25.50-$25.25.
I was a tad disappointed shares couldn’t hold the $26 level yesterday but hopefully they can today. I still think a run towards $26.50 is in the mix, and if reached, should get us a double from our entry price. However, I set a Stop Limit just in case shares fade from current levels.
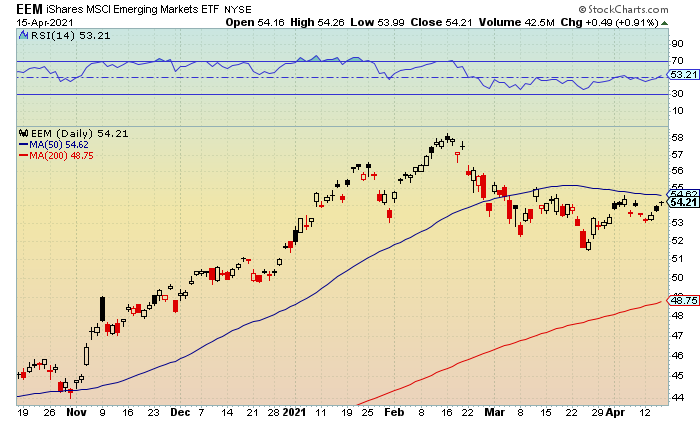
iShares MSCI Emerging Markets ETF (EEM, $54.21, up $0.49)
EEM May 55 calls (EEM210521C00055000, $0.75, up $0.10)
Entry Price: $1.00 (4/5/2021)
Exit Target: $2.00
Return: -25%
Stop Target: None
Action: Thursday’s intraday top reached $54.26 with near-term and lower resistance is at $54.25-$54.75 getting cleared but holding. A close above the latter and the 50-day moving average would be a bullish development. Rising support is at $53.50-$53.
Pre-Market Update for 4/15/2021
Blue-Chips Test Fresh All-Time High
8:00am (EST)
The stock market closed mixed on Wednesday despite exceptional earnings from the Financial sector. Technology stocks weighed down the broader market while the small-caps showed the most strength.
Fed speak was also back in focus although Chairman Powell provided little in the way of news for bond-market traders. The 10-year Treasury yield held its slight early gains after going out at 1.64% while volatility edged higher despite falling near the 15 level shortly after the opening bell.
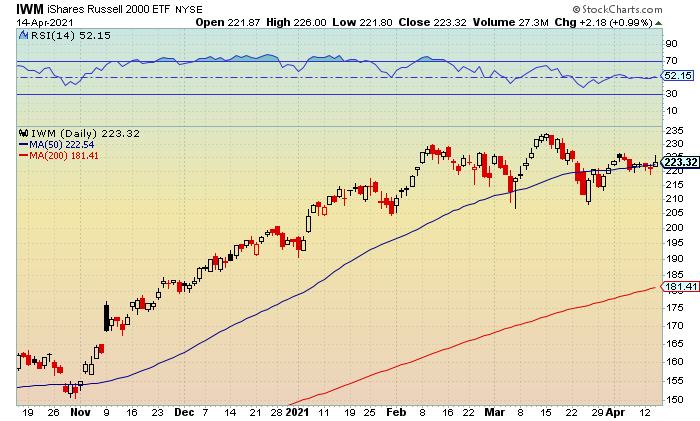
The Russell 2000 tapped a morning high of 2,272 while ending at 2,247 (+0.8%) and back above its 50-day moving average Current and lower resistance at 2,250-2,275 was cleared but failed to hold. A move above the latter would indicate additional upside towards 2,300-2,325. Below is a chart of the IWM.
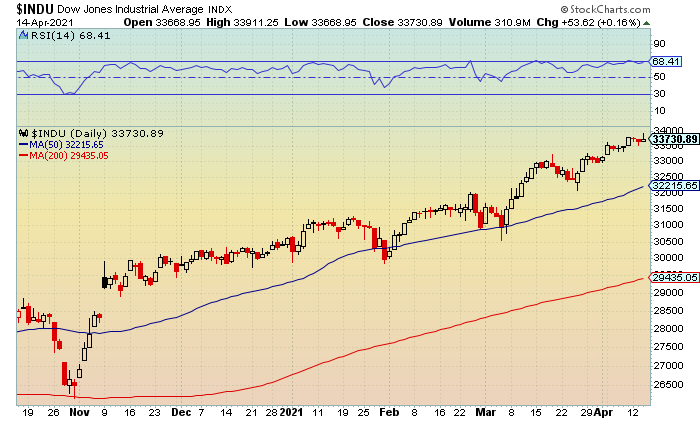
The Dow closed at 33,730 (+0.2%) with the intraday record high tagging 33,911. Unchartered territory and lower resistance at 33,750-34,000 was breached but held. A close above the latter would signal ongoing momentum towards 34,250-34,500.
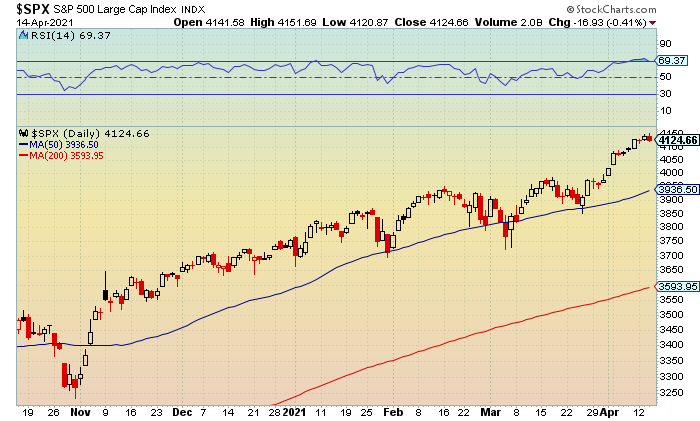
The S&P 500 finished lower at 4,124 (-0.4%) despite trading to an all-time peak of 4,151. Key resistance at 4,150 tripped but held for the second-straight session. A close above this level would suggest ongoing strength towards 4,175-4,200.
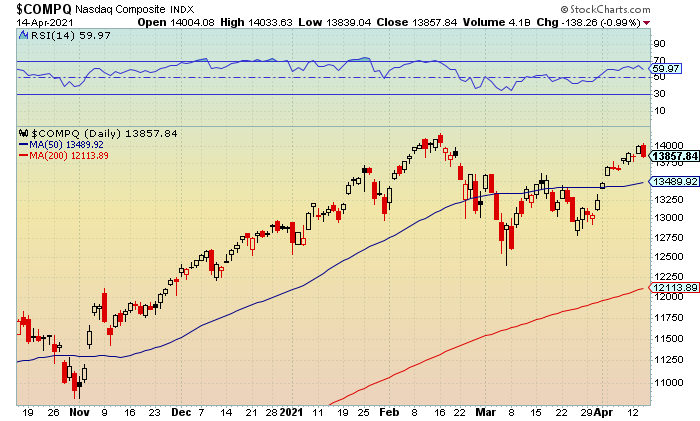
The Nasdaq traded to an opening high of 14,033 before settling in negative territory at 13,857 (-1%). Near-term and lower resistance at 14,000-14,150 was breached but held for the second-straight day. A close above the latter and the record peak at 14,175 would indicate strength towards 14,200-14,350.
Market Movers
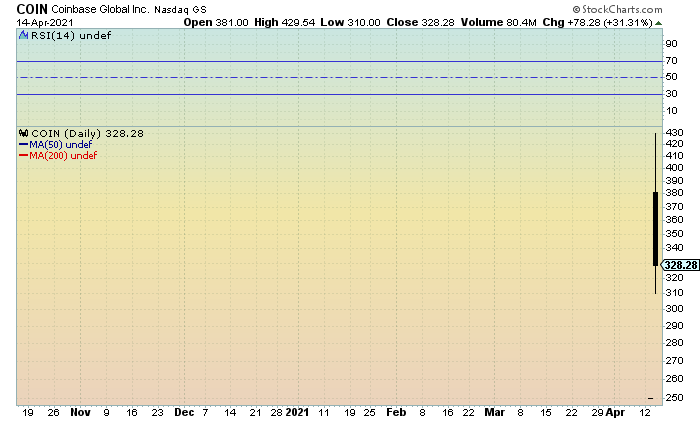
Shares of Coinbase (COIN) rallied 31% following its debut after a direct listing on the Nasdaq. The exchange determined a reference price of $250 and the stock opened at $381 per share. The shares climbed as high as $429.54 intraday, valuing the company at $112 billion, before dropping from there to close at $328.28.
Volatility Index
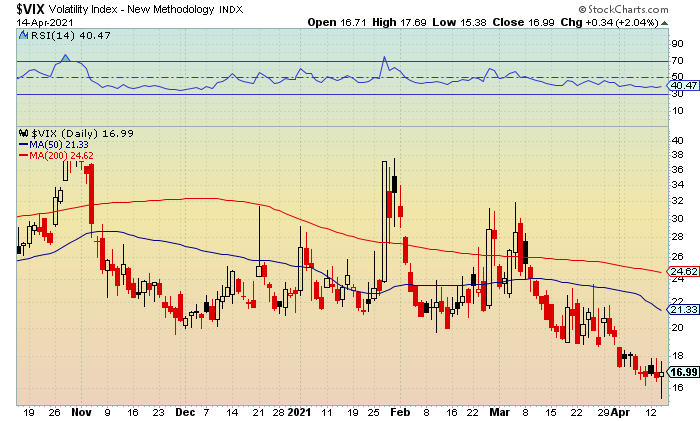
The iPath S&P Vix Short-Term Futures (NYSE: VIX) was up for the second time in three sessions despite tapping a fresh 52-week low of 15.38. Longer-term and upper support at 15.50-15 was tripped but held.
The bounce to 17.69 afterwards breached but held lower resistance at 17.50-18. A close above 18.50 would suggest strength towards 19.50-20.
Market Analysis
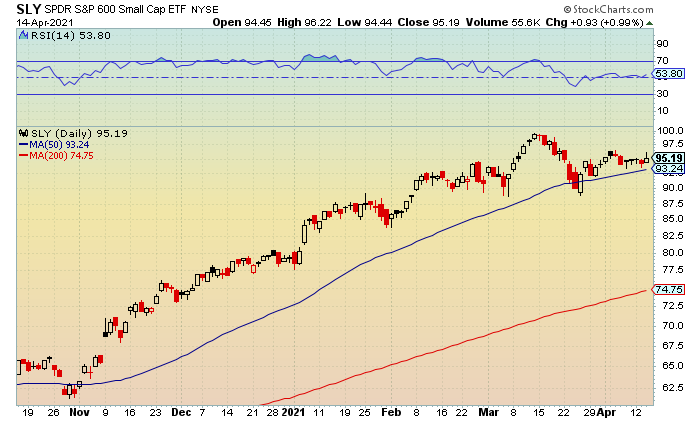
The Spider Small-Cap 600 ETF (NYSE: SLY) was up for the fourth time in five sessions following the intraday run to $96.22. Near-term and lower resistance at $96-$96.50 was cleared but failed to hold. A close above the latter would suggest additional strength towards $97.50-$98 with the all-time peak from mid-March at $99.71.
Support is at $95-$94.50 followed by $93.50-$93 and the 50-day moving average.
RSI (relative strength indicator) is back in a slight uptrend with key resistance at 55 holding. A move above this level would suggest additional upside towards 60-65. Support is at 50-45.
Sector
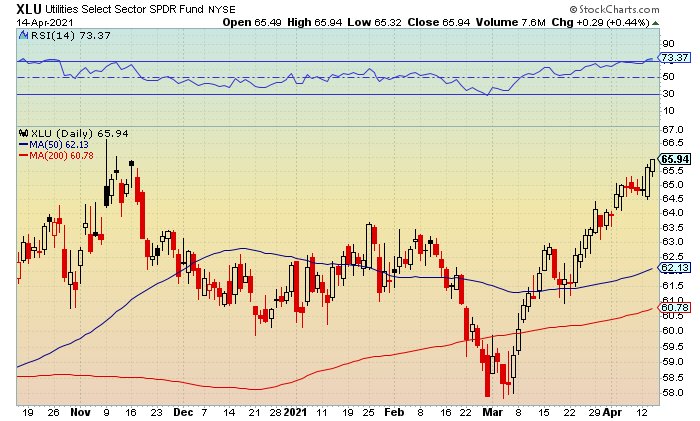
The Utilities Select Spider Fund (NYSE: XLU) extended its winning streak to three-straight sessions after closing on the session high of $65.94. Prior and lower resistance from early November at $65.50-$66 was cleared and held. A move above the latter would indicate a retest towards $67-$67.50 with the all-time peak at $67.93.
Support is at $65.50-$65.
RSI is in an uptrend with lower resistance at 70-75 getting cleared and holding. A close above the latter would suggest additional strength towards 80-85 and the monthly highs from January 2020. Support is at 65-60.
Market Outlook
Bank of America (BAC), Citigroup (C), Delta Air Lines (DAL), PepsiCo (PEP), Taiwan Semiconductor Manufacturing (TSM) are some of the major companies announcing ahead of this morning’s open.
I’m hoping to have another new trade this week but wanted to see how earnings would start to unfold. So far, so good. In the meantime, I have updated our current trades so let’s go check the tape.
Options Play List
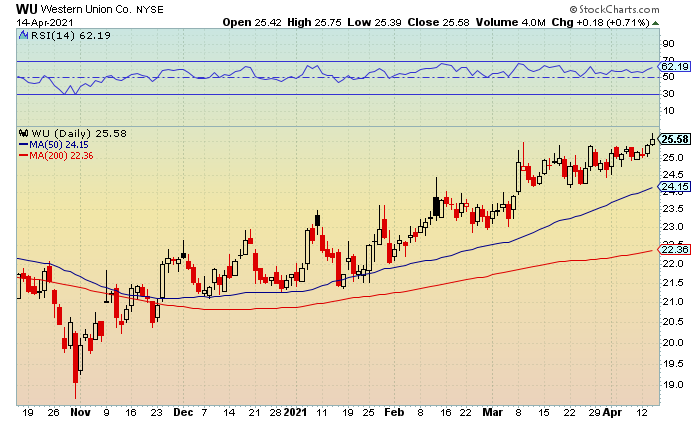
Western Union (WU, $25.58, up $0.18)
WU May 26 calls (WU210521C00026000, $0.70, up $0.05)
Entry Price: $0.60 (4/7/2021)
Exit Target: $1.20
Return: 16%
Stop Target: None
Action: Shares traded to a 52-week high of $25.75 with the options hitting 77 cents. Fresh and lower resistance at $25.75-$26 was kissed but held. There is breakout potential towards $26.50-$26.75 on continued momentum. Rising support is at $25.25-$25.
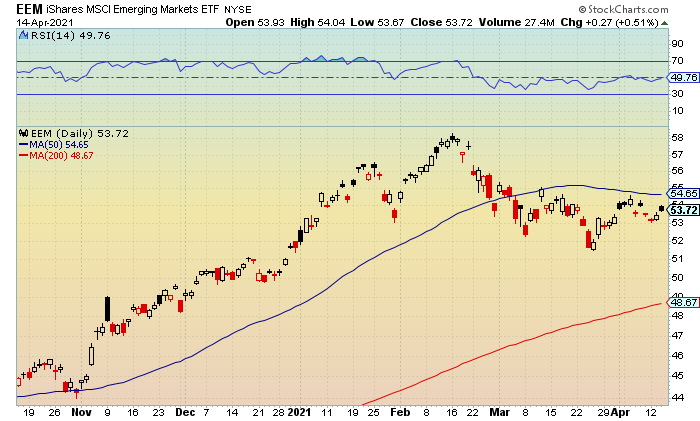
iShares MSCI Emerging Markets ETF (EEM, $53.72, up $0.27)
EEM May 55 calls (EEM210521C00055000, $0.65, up $0.05)
Entry Price: $1.00 (4/5/2021)
Exit Target: $2.00
Return: -35%
Stop Target: None
Action: Wednesday’s peak reached $54.04 with near-term and lower resistance is at $54-$54.50 getting breached but holding. Support is at $53.50-$53.
Pre-Market Update for 4/14/2021
Vaccine News Weighs on Market Momentum
8:00am (EST)
The stock market was mixed on Tuesday after U.S. federal health officials issued for a pause in the rollout of Johnson & Johnson’s (JNJ) coronavirus vaccine following concerns over rare blood clots in some individuals who received the shot. Consumer price inflation was also a little hotter than expectations although the rise was less pronounced when excluding volatile food and energy prices.
Despite the headlines, Tech showed strength while recovering the previous session losses with the broader market rising as well. The blue-chips and small-caps lagged while volatility inched slightly lower ahead of the “official” start to the first quarter earnings season.
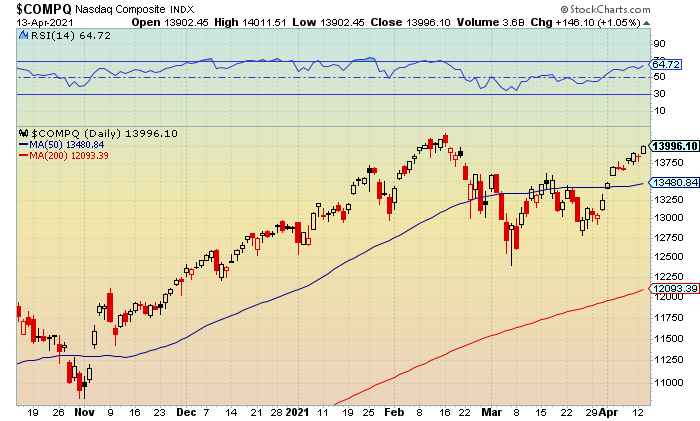
The Nasdaq closed at 13,996 (+1.1%) after trading to an afternoon high of 14,011. Prior and lower resistance from mid-February at 14,000-14,150 was breached but held. A move above the latter and the current all-time peak at 14,175 would indicate strength towards 14,200-14,350.
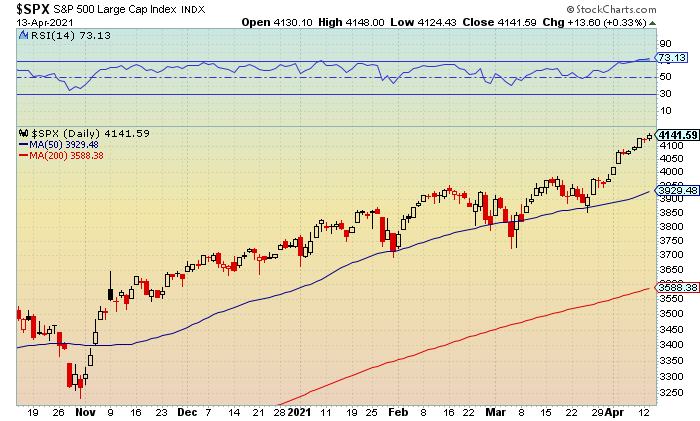
The S&P 500 tested an all-time high of 4,148 while finishing at 4,141 (+0.3%). Unchartered territory and lower resistance at 4,150-4,175 was challenged but held. A close above the latter would suggest ongoing momentum towards 4,200-4,225.
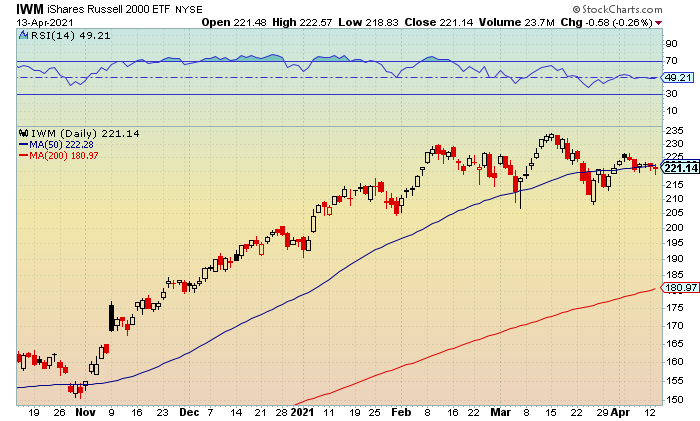
The Russell 2000 tagged a midday low of 2,208 before ending at 2,228 (-0.2%). Prior and upper support at 2,225-2,200 was tripped but held. A drop below the latter would signal a further fade towards 2,175-2,150. Below is a chart of the IWM.
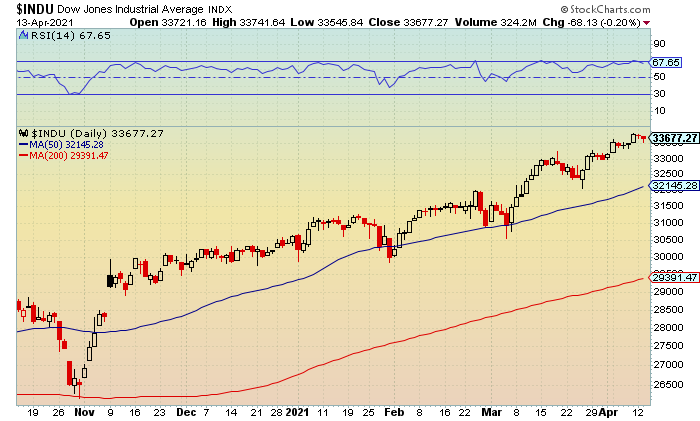
The Dow settled at 33,677 (-0.2%) with the intraday low tagging 33,545 (-0.2%). Near-term and upper support at 33,500-33,250 was challenged but held. A close below the latter would indicate a continued pullback towards 33,000-32,750.
Market Movers
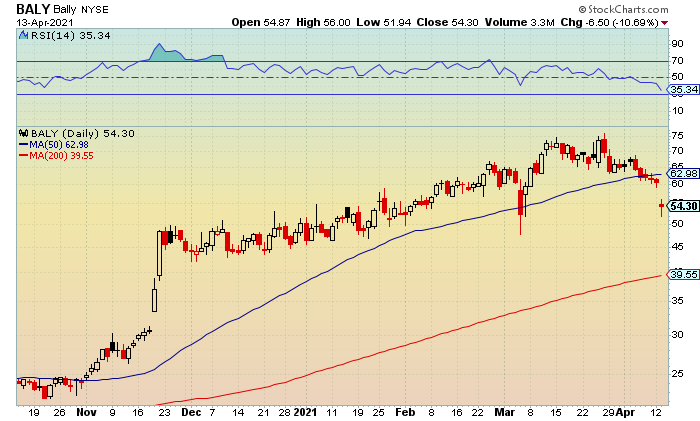
Shares of Bally’s (BALY) dropped 10% after announcing an agreement with U.K. gambling company Gamesys Group that will combine the two companies in a deal valued at nearly $2.8 billion.
Volatility Index
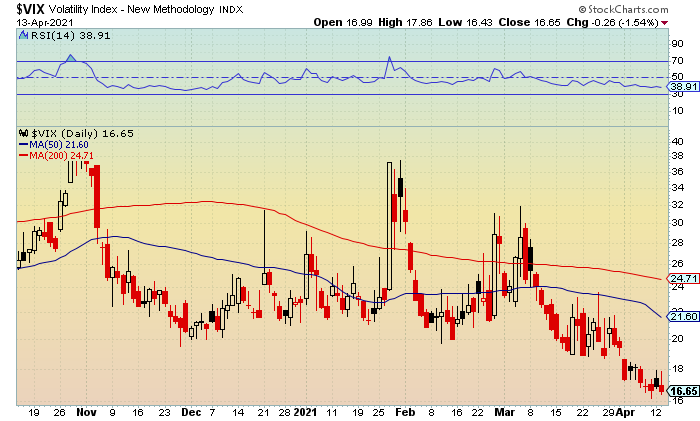
The iPath S&P Vix Short-Term Futures (NYSE: VIX) fell for the fourth time in five sessions despite the opening peak reaching 17.86. Near-term and lower resistance at 17.50-18 was cleared but held for the second-straight session.
The fade to 16.43 afterwards breached but held upper support at 16.50-16. A close below last Friday’s 52-week low at 16.20 would signal weakness towards 15.50-15.
Market Analysis
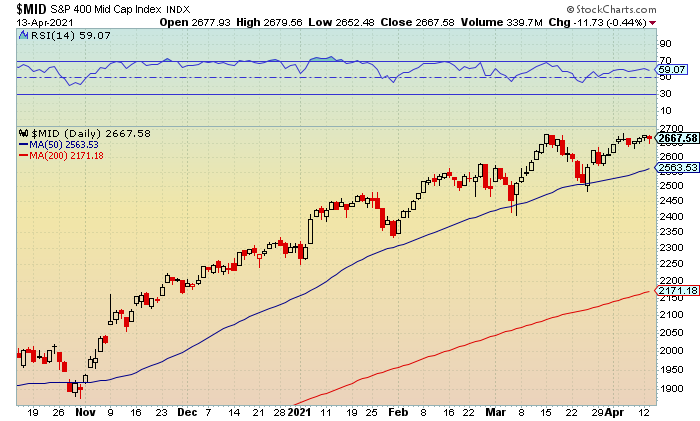
The S&P 400 Mid Cap Index (NYSE: MID) had its three-session winning streak snapped following the intraday pullback to 2,652. Current and upper support at 2,675-2,650 failed to hold. A move below the latter would indicate additional weakness towards 2,625-2,600.
Key resistance is at 2,700 with the mid-March all-time high at 2,682 that was tagged in back-to-back sessions.
RSI (relative strength index) is in a slight downtrend with key resistance at 60 failing to hold. Continued closes below this level would signal weakness towards 55-50. Resistance is at 65-70.
Sector
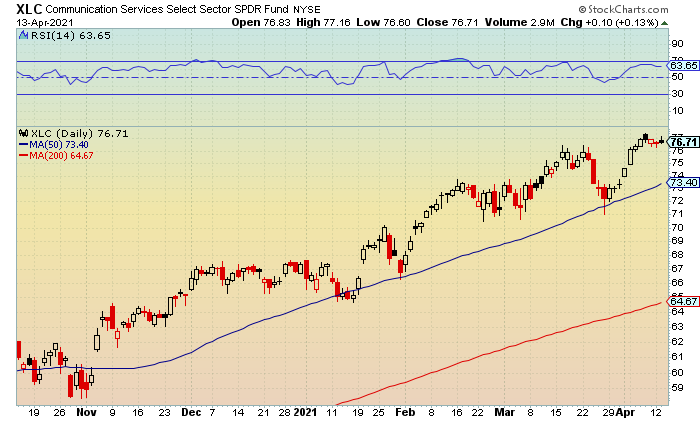
The Communication Services Select Sector SPDR (NYSE: XLC) rebounded following the morning run to $77.16. Near-term and lower resistance at $77-$77.50 was tripped but held. A move above the latter and the recent all-time top at $77.39 would suggest a breakout towards $78.50-$79.
Support is at $76.50-$76 followed by $75-$74.50.
RSI has leveled out with lower resistance at 65-70 holding. A close above the latter would indicate additional upside towards 75 and the mid-February high. Support is at 60-55.
Market Outlook
Goldman Sachs Group (GS), JPMorgan Chase (JPM) and Wells Fargo (WFC) will kick off first-quarter earnings season this morning. Goldman is expected to report a profit of $10.22 a share on revenue of $12.6 billion while JPMorgan is forecast to earn $3.09 a share on $30.5 billion. Wells Fargo is estimated to do 70 cents a share on $17.5 billion.
All three stocks are just below their 52-week and all-time highs from mid-March and likely need a beat-and raise quarter for them to a make a run towards prior peaks. If so, the Financial sector could also help the major indexes keep their current momentum going.
Options Play List
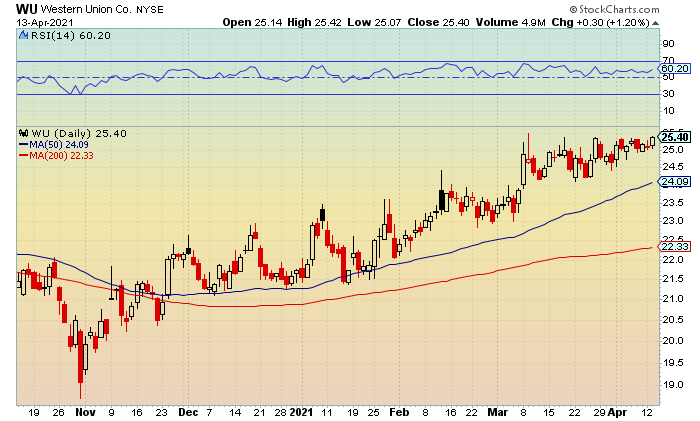
Western Union (WU, $25.40, up $0.30)
WU May 26 calls (WU210521C00026000, $0.65, up $0.10)
Entry Price: $0.60 (4/7/2021)
Exit Target: $1.20
Return: 8%
Stop Target: None
Action: Tuesday’s late day peak reached $25.42 with lower resistance at $25.25-$25.50 getting recovered. Support is at $25.25-$25.
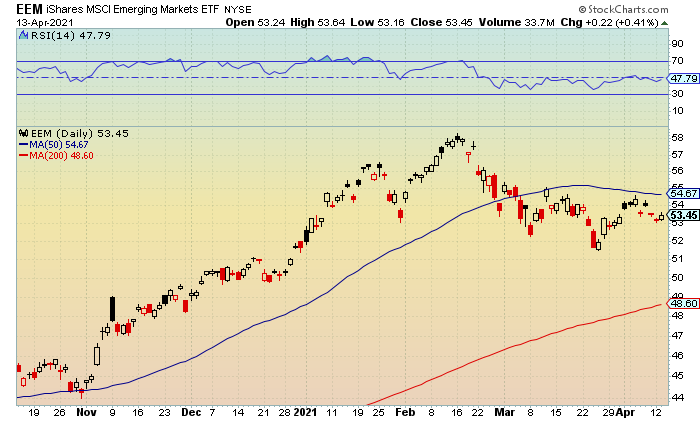
iShares MSCI Emerging Markets ETF (EEM, $53.23, down $0.32)
EEM May 55 calls (EEM210521C00055000, $0.60, up $0.05)
Entry Price: $1.00 (4/5/2021)
Exit Target: $2.00
Return: -40%
Stop Target: None
Action: Shares traded up to $53.64 with lower resistance is at $53.50-$54 getting cleared but holding. Support remains at $53.25-$52.75.
Pre-Market Update for 4/13/2021
Market Dips As Wall Street Awaits Earnings
8:00am (EST)
The stock market slipped on Monday as Wall Street awaits the start of the first-quarter earnings season that begins midweek. The losses were kept in check following comments from Fed Chairman Powell who reiterated that the central bank will continue to support the recovery until the job is done.
Powell also stressed that a rate increase this year would be highly unlikely and added that it will be a while before the economy gets to the place where the Federal Funds rate can be lifted.
The Russell 2000 closed at 2,233 (-0.4%) after tapping a morning low of 2,222. Near-term and upper support at 2,240-2,220 and the 50-day moving average were breached and levels that failed to hold. A move below the latter would indicate additional weakness towards 2,200-2,180. Below is a chart of the IWM.
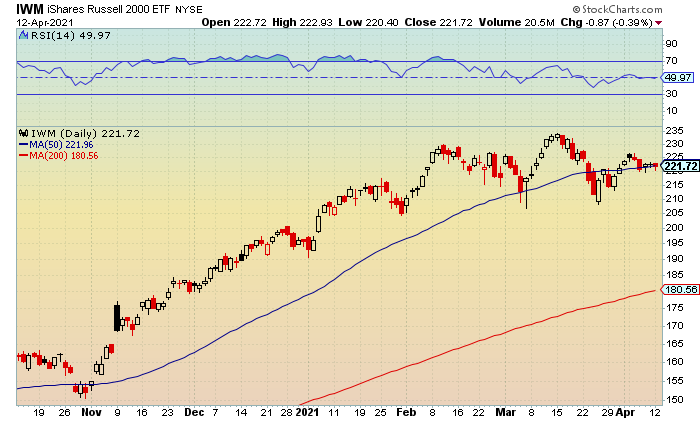
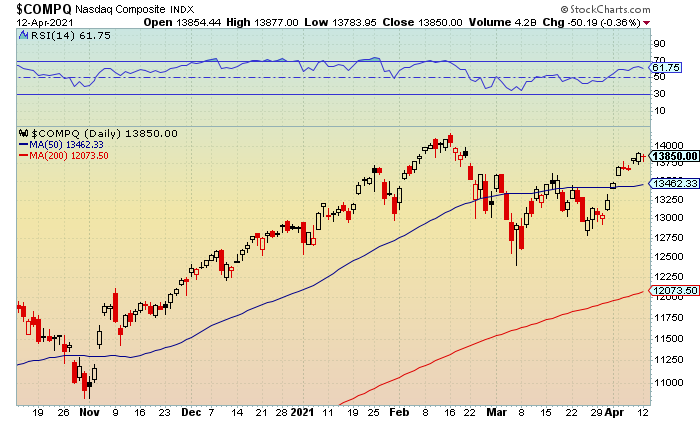
The Nasdaq tested a first half low of 13,783 before ending at 13,850 (-0.4%). Current and upper support at 13,800-13,650 was breached but held. A close below the latter would suggest a continued fade towards 13,500-13,350.
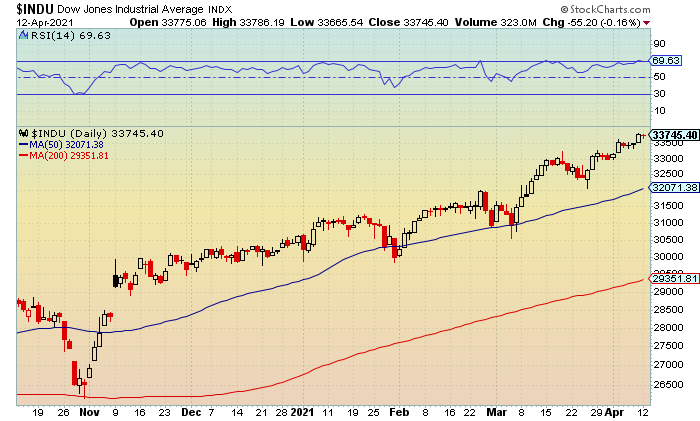
The Dow finished at 33,745 (-0.2%) with the afternoon bottom hitting 33,665 (-0.2%). Near-term and upper support at 33,750-33,500 failed to hold. A drop below the latter would signal ongoing weakness towards 33,250-33,000.
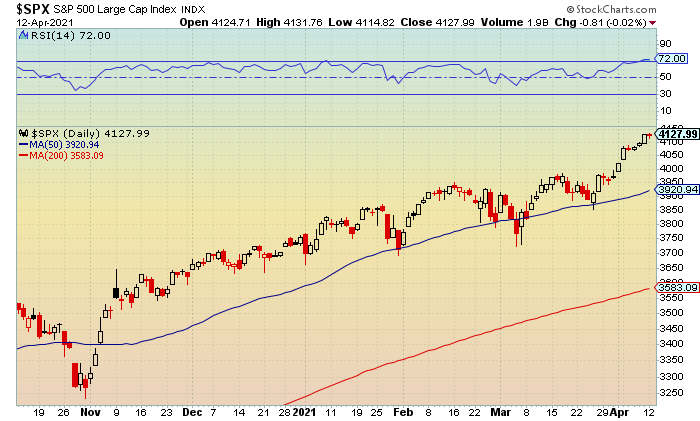
The S&P 500 tagged a midday all-time high of 4,131 before settling a point lower at 4,127 (-0.02%). Unchartered territory and lower resistance at 4,130-4,155 was cleared but held. A move above the latter would indicate upside towards 4,175-4,200.
Market Movers
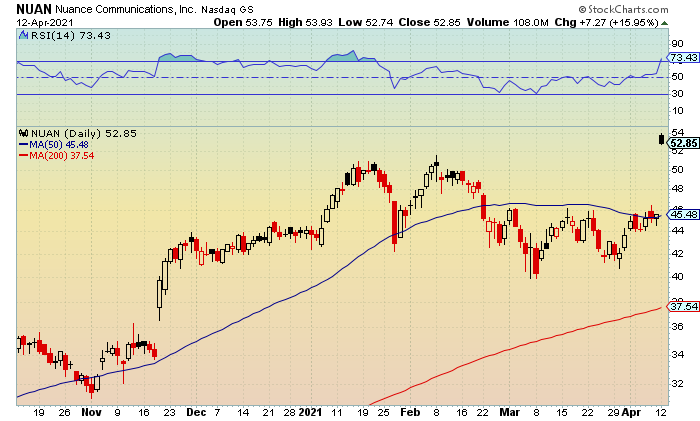
Shares of Nuance Communications (NUAN) soared 16% following news the company will be acquired by Microsoft (MSFT) for $56 per a share. The deal was an all-cash transaction valued at $19.7 billion, including Nuance’s net debt.
Volatility Index
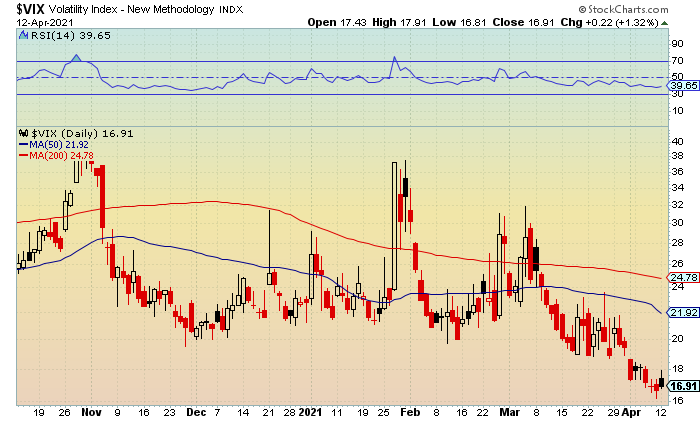
The iPath S&P Vix Short-Term Futures (NYSE: VIX) was up for the first time in four sessions with the intraday peak reaching 17.91. Near-term and lower resistance at 17.50-18 was tripped but held. A move above the latter would suggest a retest towards 19-19.50.
Support is at 16.50-16 with last Friday 52-week low at 16.20.
Market Analysis
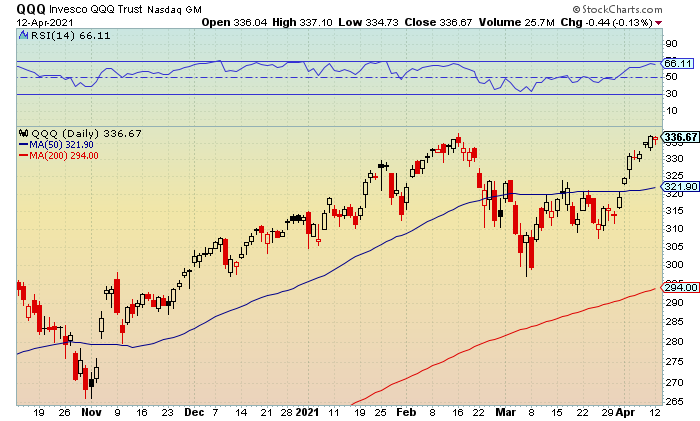
The Invesco QQQ Trust (Nasdaq: QQQ) had its three session winning streak snapped following the pullback to $334.73. Fresh and upper support at $335-$334.50 was breached but held. A close below the latter would indicate a further fade towards $333-$332.50.
Resistance is at $337-$337.50 with the mid-February all-time peak at $338.19.
RSI (relative strength indicator) has rolled over with upper support at 65-60 holding. A close below the latter would signal additional weakness towards 55-50. Key resistance is at 70 and a level that has been holding since early December.
Sector
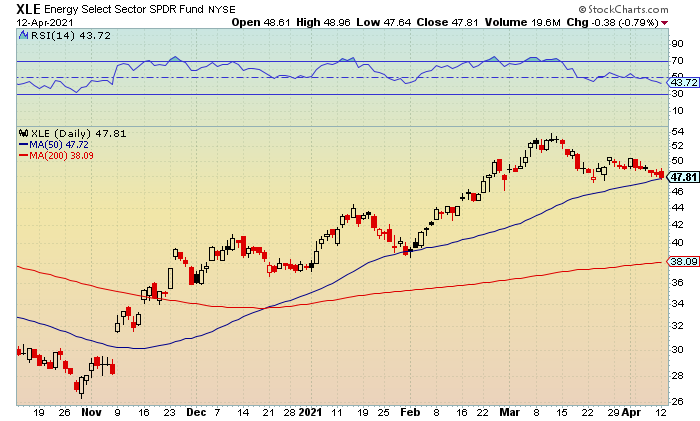
The Energy Select Sector SPDR Fund (NYSE: XLE) extended its losing streak to three-straight sessions with the intraday low kissing $47.64. Current and upper support at $48-$47.50 was clipped and failed to hold. A close below the latter and the 50-day moving average would suggest additional weakness towards $46.50-$46.
Resistance is at $48.50-$49.
RSI remains in a downtrend with upper support at 45-40 failing to hold. A close below the latter would indicate additional weakness towards 35-30 and the late October lows. Resistance is at 50-55.
Market Outlook
With earnings on hold until Wednesday, this morning’s economic news concerning consumer price inflation could have some impact on today’s action. The consumer price index (CPI) is expected to rise by more than 2% year-over-year for the first time since February 2020, as prices begin to rise above last year’s pandemic-pressured levels. The NFIB Small Business Optimism Index is also due out ahead of the opening bell.
Options Play List
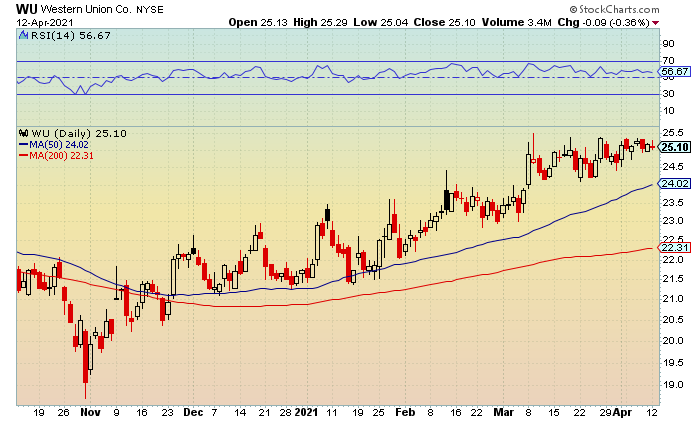
Western Union (WU, $25.10, down $0.08)
WU May 26 calls (WU210521C00026000, $0.55, down $0.05)
Entry Price: $0.60 (4/7/2021)
Exit Target: $1.20
Return: -8%
Stop Target: None
Action: Shares tested a low of $25.04 with upper support at $25-$24.75 getting challenged but holding. Resistance remains at $25.25-$25.50.
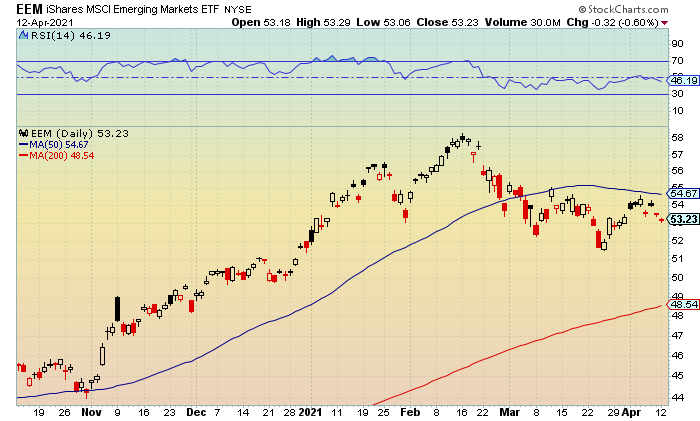
iShares MSCI Emerging Markets ETF (EEM, $53.23, down $0.32)
EEM May 55 calls (EEM210521C00055000, $0.55, down $0.10)
Entry Price: $1.00 (4/5/2021)
Exit Target: $2.00
Return: -45%
Stop Target: None
Action: Monday’s low touched $53.05 with upper support at $53.25-$52.75 failing to hold. Lowered resistance is at $53.50-$54.
Pre-Market Update for 4/12/2021
Bulls Get Weekly Win Although Small-Caps Slack
8:00am (EST)
The stock market closed mostly higher on Friday despite a choppy open with the major indexes closing out a solid week of gains. Tech recovered earlier losses to trade in positive territory while the small-caps danced in the red for most of the session before edging slightly higher into the closing bell.
The strong showing remains a bullish development ahead of the official start for the first-quarter earnings season with record highs and previous resistance levels back in play. Traders seem to believe earnings will be much better than forecasts and will provide some justification of current valuation levels.
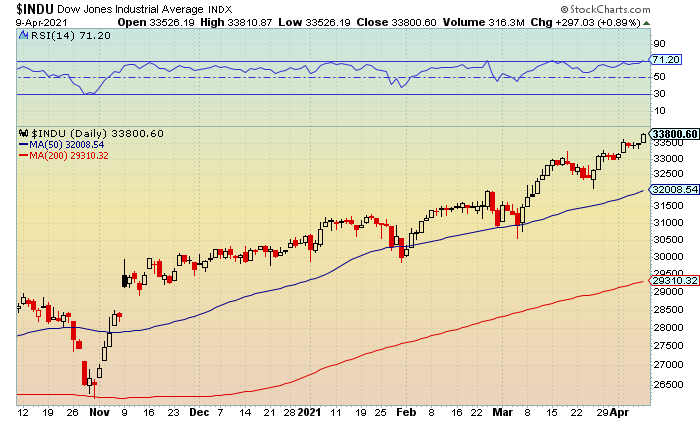
The Dow tagged an intraday and all-time high of 33,810 before settling at 33,800 (+0.9%). Unchartered territory and lower resistance at 33,750-34,000 was cleared and held. A close above the latter would suggest ongoing momentum towards 34,250-34,500.
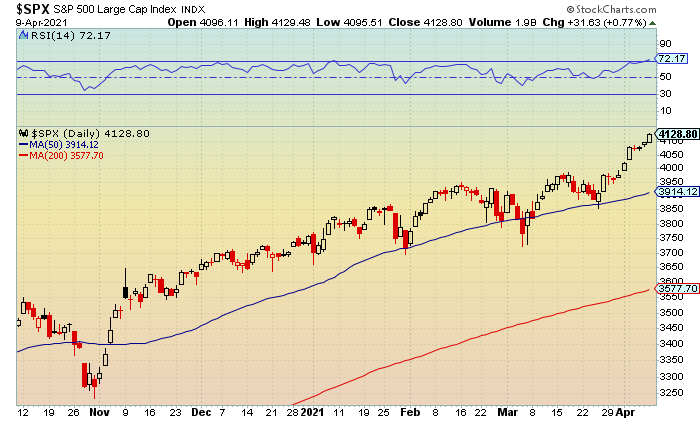
The S&P 500 tapped a fresh record peak of 4,129 before going out at 4,128 (+0.8%). Fresh and lower resistance at 4,125-4,150 was cleared and held. A move above this level keeps upside towards 4,175-4,200 in focus.
The Nasdaq traded to an afternoon high of 13,905 while closing at 13,900 (+0.5%). Prior and lower resistance from early February at 13,850-14,000 was recovered. A close above the latter would indicate a possible run towards 14,100-14,250 with the all-time peak at 14,175.
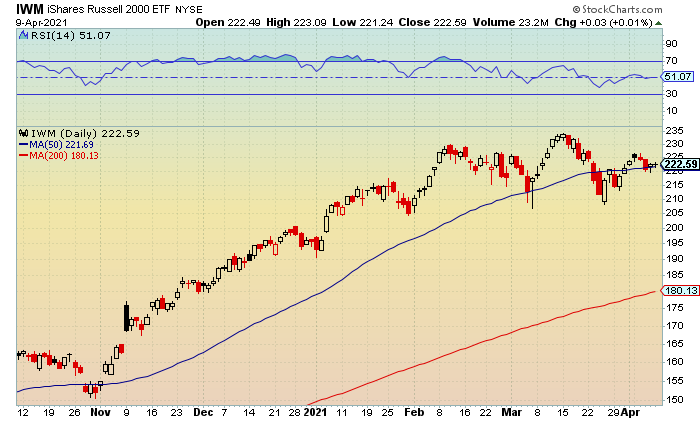
The Russell 2000 tested an opening low of 2,231 before finishing at 2,243 (+0.04%) while holding its 50-day moving average for the second-straight session. Near-term and upper support at 2,225-2,200 was challenged but held. A close below the latter would signal a backtest towards 2,175-2,150. Below is a chart of the IWM.
Market Movers
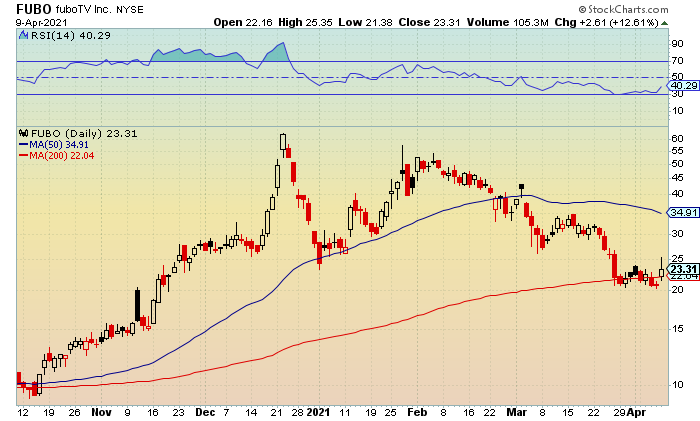
FuboTV (FUBO) shares rallied nearly 12% following news it has acquired the exclusive live streaming rights to the Qatar World Cup 2022 Qualifying matches of the South American Football Confederation.
Volatility Index
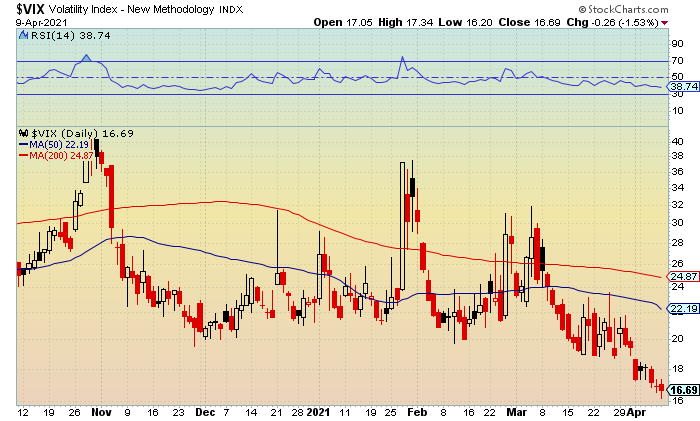
The iPath S&P Vix Short-Term Futures (NYSEArca: VIX) fell for the third-straight session with the fresh 52-week low hitting 16.20. Upper support at 16.50-16 was breached but held. A move below the latter would indicate ongoing weakness towards 15.50-15.
Lowered resistance is at 17-17.50 followed by 18.50-19.
Market Analysis
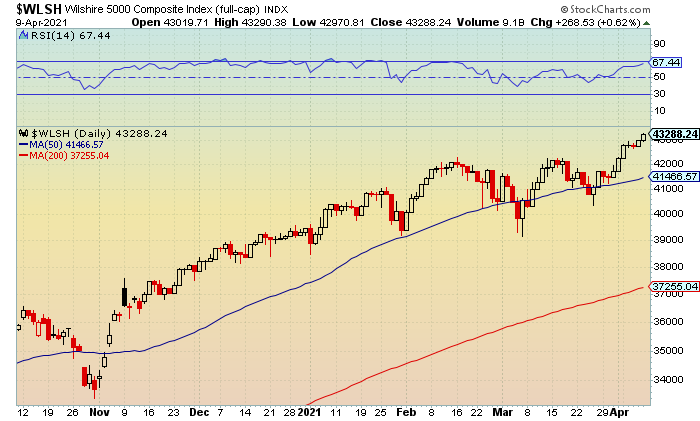
The Wilshire 5000 Composite Index (NYSE: WLSH) was up for the sixth time in seven sessions with the intraday and new record high tapping 43,290. Uncharted territory and lower resistance at 43,250-43,500 was cleared and held. A move above the latter would indicate ongoing momentum towards 43,750-44,000.
Support is at 43,000-42,750.
RSI (relative strength index) is in an uptrend with key resistance at 70 holding. A close above this level would signal strength towards 75 and the high from January. Support is at 65-60.
Sector
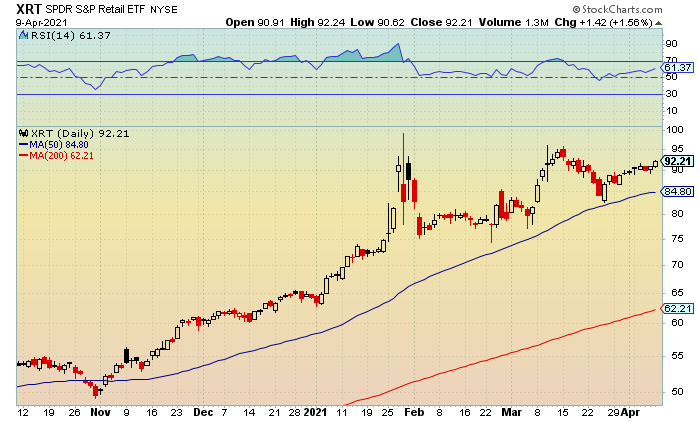
The Spider S&P Retail ETF (NYSE: XRT) rose for the second-straight session with the late day peak reaching to $92.24. Prior and lower resistance from mid-March at $92-$92.50 was recovered. A close above the latter would suggest additional strength towards $93.50-$94.
Support is at $91.50-$91 followed by $90-$89.50.
RSI is in a uptrend with lower resistance at 60-65 getting cleared and holding. A close above the latter would suggest upside towards 70-75 and the March highs. Support is at 55-50.
Market Outlook
There could be some choppiness heading into midweek as the market awaits earnings from the Financial sector starting on Wednesday. Fastenal (FAST) is the only noteworthy name announcing before then on Tuesday morning. With that said, it appears there could be continued market momentum for another two weeks before a possible top. However, the tax deadline has moved into mid-May this year from April and usually when there is monthly weakness.
A good signal for market bullishness remains the VIX which could trade to and below the 15 level over the near-term. With the major indexes pushing all-time highs, it is typical to see volatility test the mid to low teens. A slight warning sign on when to lighten up bullish trades will be when the VIX closes back above the 19.50-20 area.
Options Play List
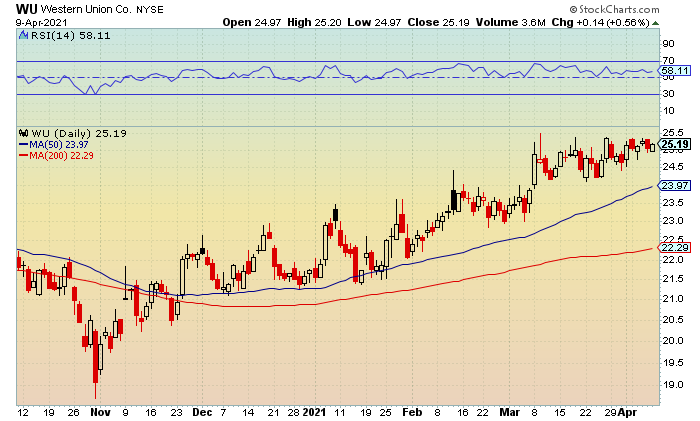
Western Union (WU, $25.19, up $0.14)
WU May 26 calls (WU210521C00026000, $0.60, up $0.05)
Entry Price: $0.60 (4/7/2021)
Exit Target: $1.20
Return: 0%
Stop Target: None
Action: Friday’s peak reached $25.20 with lower resistance at $25.25-$25.50 getting challenged but holding. The March 52-week high hit $25.73 and a level I would like to see cleared this week. Support is at $25-$24.75.
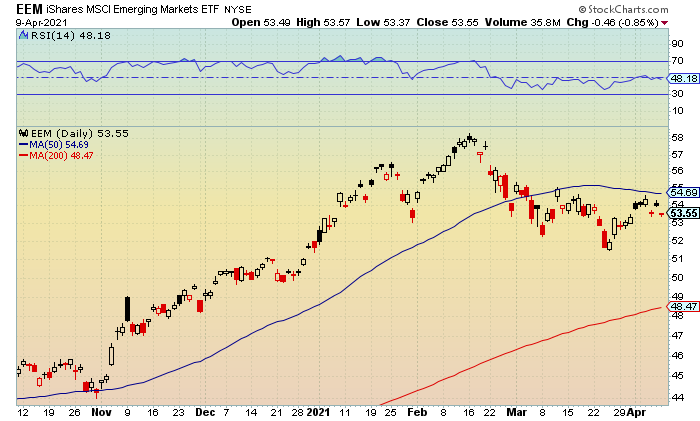
iShares MSCI Emerging Markets ETF (EEM, $53.55, down $0.46)
EEM May 55 calls (EEM210521C00055000, $0.65, down $0.20)
Entry Price: $1.00 (4/5/2021)
Exit Target: $2.00
Return: -35%
Stop Target: None
Action: Shares tagged a low of $53.37 with upper support at $53.50-$53 getting breached but holding. Resistance is at $54-$54.50 and the 50-day moving average.
Pre-Market Update for 4/9/2021
Record Highs Back in Focus
8:00am (EST)
The stock market regained momentum on Thursday with all of the major indexes closing higher and the broader market flirting with recent records. Much of the rally was attributed to Fed Chairman Powell after he said once again that the central bank has the tools to handle any temporary inflation pressures.
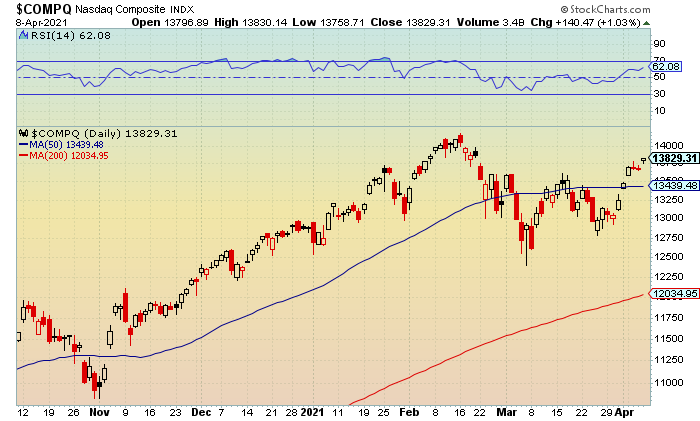
The Nasdaq traded to a late day high of 13,830 before settling at 13,829 (+1%). Prior and lower resistance from early February at 13,750-13,900 was recovered. A close above the latter would signal a retest towards 14,000-14,150 with the all-time peak at 14,175.
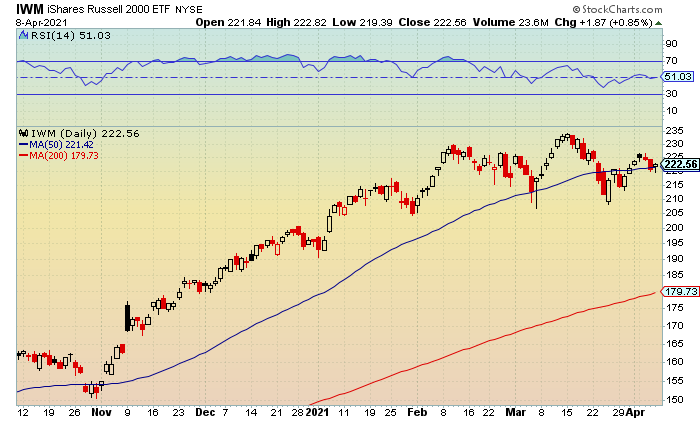
The Russell 2000 tapped a high of 2,243 while ending at 2,242 (+0.9%). Current and lower resistance at 2,225-2,250 and the 50-day moving average were cleared and held. A move above the latter would indicate additional upside towards 2,275-2,300. Below is a chart of the IWM.
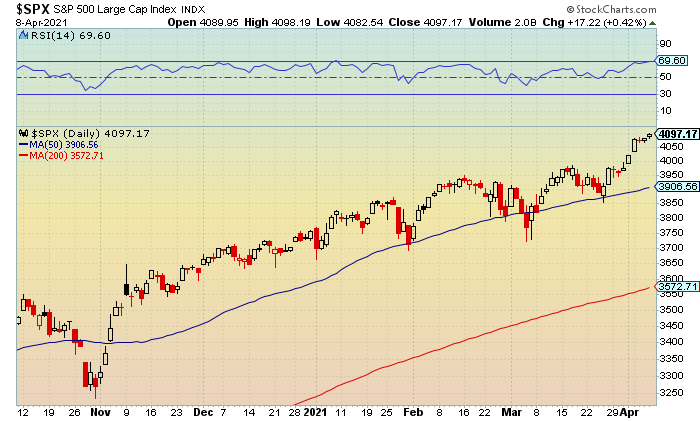
The S&P 500 finished at 4,097 (+0.4%) with the all-time peak hitting 4,098 ahead of the closing bell. Key resistance at 4,100 was once again challenged but held for the fourth-straight session. A pop above this level would suggest ongoing strength towards 4,125-4,150.
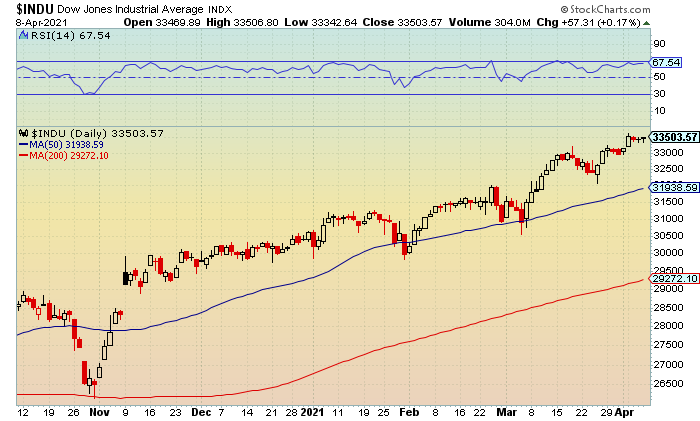
The Dow closed at 33,503 (+0.2%) with the afternoon high tagging 33,506. Near-term and lower resistance at 33,500-33,750 was recovered. A move above the latter and the all-time high of 33,617 would signal a breakout towards the 34,000 area.
Market Movers
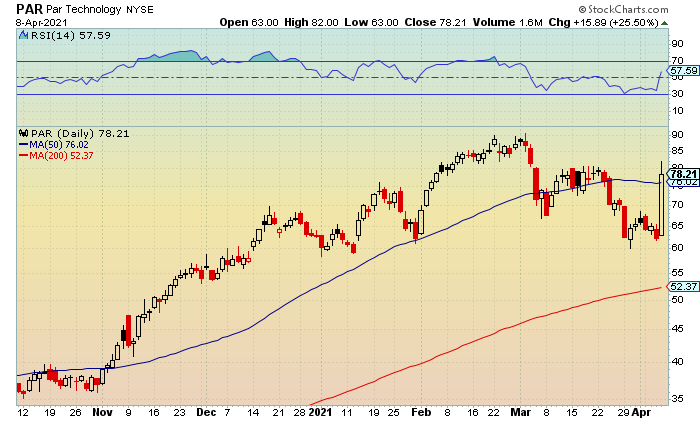
Par Technology (PAR) zoomed 25% after announcing it has acquired Punchh for roughly $500 million in cash and stock. Punchh provides apps for restaurants that engage people in games and rewards systems that are all hooked into point of sale (POS) systems.
Volatility Index
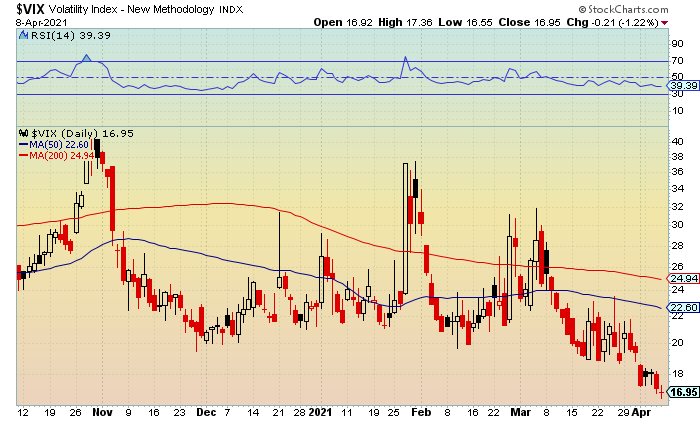
The iPath S&P Vix Short-Term Futures (NYSEArca: VIX) tested a second-straight 52-week low of 16.55 with upper support at 17-16.50 getting breached and holding. A drop below the latter would indicate additional weakness towards 15.50-15.
Lowered resistance is at 17.50-18 followed by 19-19.50.
Market Analysis
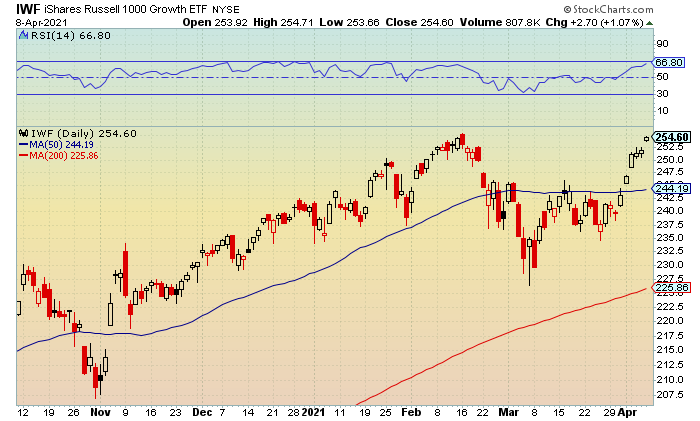
The iShares Russell Growth 1000 ETF (NYSE: IWF) extended its winning streak to six-straight sessions with the second half high tapping $254.71. Prior and lower resistance from mid-February at $254.50-$255 was recovered. A move above the latter and the all-time peak of $255.61 would suggest a breakout towards $257-$257.50.
Fresh support is at $253.50-$253 followed by $251.50-$251.
RSI remains in an uptrend with lower resistance at 65-70 getting cleared and holding. A close above the latter would suggest additional strength towards 75-80 and overbought levels from late August/ early September. Support is at 60.
Sector
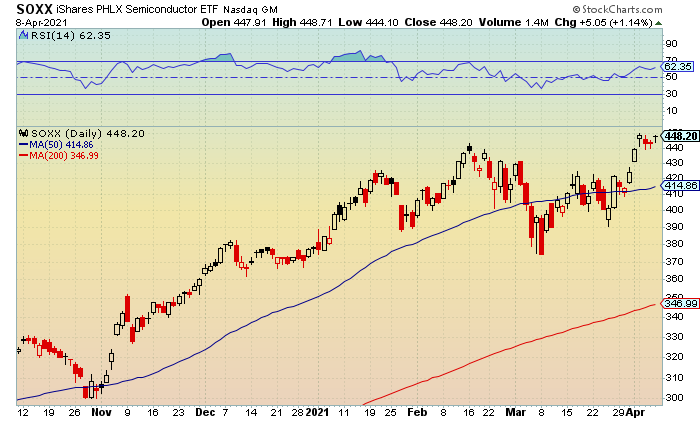
The iShares PHLX Semiconductor ETF (Nasdaq: SOXX) rebounded following the intraday trip to $448.71. Current and lower resistance at $448.50-$449 was breached but held. A close above the latter and Monday’s all-time top at $449.76 would signal a breakout towards the $452-$452.50 area.
Current support $444.50-$444.
RSI is back in a slight uptrend with key resistance at 65 holding. Continued closes above this level would signal additional strength towards 70-75 and levels from January. Support is at 60-55.
Market Outlook
The major indexes showed strength last Thursday and on Monday to signal money was moving back into the market. Another positive close today would be a bullish signal to start next week with first quarter earnings coming into focus. Financials will be the center of attention with JPMorgan (JPM) and Wells Fargo (WFC) reporting Wednesday morning.
Options Play List
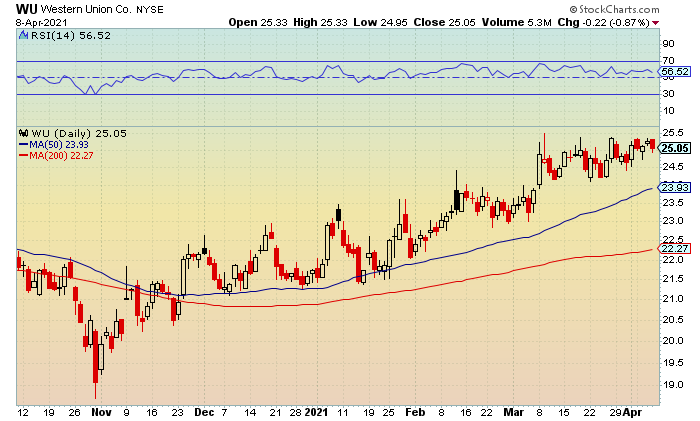
Western Union (WU, $25.05, down $0.22)
WU May 26 calls (WU210521C00026000, $0.60, down $0.05)
Entry Price: $0.60 (4/7/2021)
Exit Target: $1.20
Return: 0%
Stop Target: None
Action: Shares tested an intraday low of $24.95 with current and upper support at $25-$24.75 getting tripped but holding. Resistance remains at $25.50-$25.75 with the early March 52-week high at $25.73.
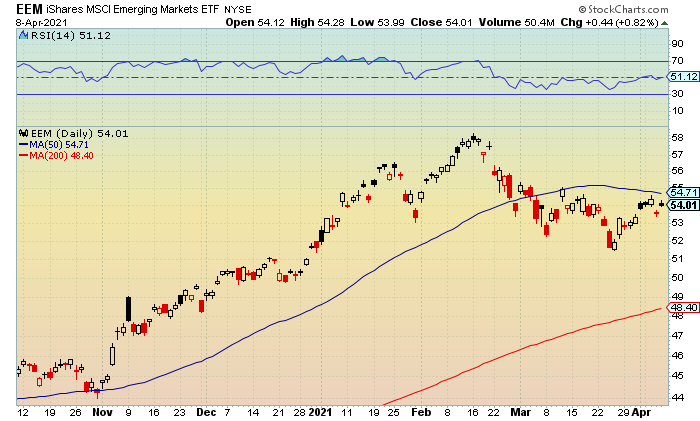
iShares MSCI Emerging Markets ETF (EEM, $54.01, up $0.44)
EEM May 55 calls (EEM210521C00055000, $0.85, up $0.20)
Entry Price: $1.00 (4/5/2021)
Exit Target: $2.00
Return: -15%
Stop Target: None
Action: Thursday’s peak reached $54.28 with lower resistance at $54-$54.50 getting recovered. I would like to see a close above double-nickels and the 50-day moving average today. Support is at $53.50-$53.
Pre-Market Update for 4/8/2021
Fed Minutes Not Much Impact/ Profit Alert (UTZ)/ Trade Alert (IGT)
8:00am (EST)
The stock market traded in a narrow range ahead of and after the latest meeting minutes from the Federal Reserve before closing mixed on Wednesday. The Fed noted the economy was far from achieving their broad-based goal of maximum employment, suggesting a sharper and more sustained rebound would be needed before policymakers begin to think about tightening.
The S&P 500 made a morning run to 4,083 while settling at a record close of 4,079 (+0.2%). Key resistance at 4,100 was challenged but held for the third-straight session. A move above this level would signal momentum towards 4,125-4,150.

The Dow tested an intraday low of 33,347 before finishing slightly higher at 33,446 (+0.1%). Near-term and upper support at 33,250-33,000 was challenged but easily held. A drop below the the latter would suggest a further pullback towards 32,750-32,500.

The Nasdaq ended at 13,688 (-0.1%) with the opening low reaching 13,653. Current and upper support at 13,600-13,450 was challenged but held. A close below the latter and the 50-day moving average would indicate a further fade towards 13,400-13,250.

The Russell 2000 closed at 2,223 (-1.6%) after tapping a late day low of 2,217. Near-term and upper support at 2,225-2,200 and the 50-day moving average were breached and failed to hold. A move below the latter would signal additional weakness towards 2,175-2,150. Below is a chart of the IWM.

Market Movers
Shares of FibroGen (FGEN) sank 43% after the FDA informed the company that it has tentatively scheduled a Cardiovascular and Renal Drug Advisory Committee on July 15th to review the new drug application for roxadustat. The drug is being developed for the treatment of anemia of chronic kidney disease in both dialysis-dependent and non-dialysis-dependent patients.

Volatility Index
The iPath S&P Vix Short-Term Futures (NYSEArca: VIX) was down for the first time in three sessions following the intraday fade to 16.87 and fresh 52-week low. Upper support from February 2020 at 17-16.50 was breached but held. A close below the latter would signal ongoing weakness towards 15.50-15.
Resistance is at 18-18.50 followed by 19.50-20.

Market Analysis
The SPDR S&P 500 ETF (NYSE: SPY) was up for the fourth time in five sessions after trading to a high of $406.96. Current and lower resistance at $406.50-$407 was cleared and held. A close above the latter and Tuesday’s all-time peak at $407.24 would indicate additional upside towards $408.50-$409.
Near-term support is at $405.50-$405 followed by $403.50-$403.
RSI (relative strength index) has flatlined with key resistance at 70 holding. A close above this level would suggest a run towards 75-80 and overbought territory from late August/ early September. Support is at 65-60.

Sector
The SPDR S&P Homebuilders ETF (NYSE: XHB) had its three-session winning streak snapped following the late day pullback to $71.90. Fresh and upper support at $72-$71.50 was breached but held. A close below the latter would signal additional weakness towards $70.50-$70.
Resistance is at $73-$73.50 with Tuesday’s all-time peak at $73.28.
RSI has rolled over with upper support at 65-60 holding. A close below the latter would suggest additional risk towards 55-50. Resistance is at 70-75 with the latter representing the January peak.

Market Outlook
The current action is signaling the market is awaiting the start of first quarter earnings season next week with the major indexes remaining in a possible trading range until the numbers start to come out. The action in the VIX remains a bullish signal along with the pullback in the 10-year treasury yield.
Aside from Tech and the small-caps, the broader market is showing slightly overbought levels. With the Russell 2000 closing below its 50-day moving average, and Tech just 2% above this this technical indicator, there is also the chance of lower lows to end the week.
Regardless, the portfolio will be in great shape with only two open trades heading into next week’s action. If the bulls can hold near-term support levels, April is still looking good for higher highs. There wild card remains the VIX with a close above 20 signaling a possible near-term top.
Options Play List
Western Union (WU, $25.27, up $0.15)
WU May 26 calls (WU210521C00026000, $0.65, up $0.05)
Entry Price: $0.60 (4/7/2021)
Exit Target: $1.20
Return: 8%
Stop Target: None
Action: Shares tested an opening high of $25.35 with current and lower resistance at $25.25-$25.50 getting recovered. Continued closes above $25.50 could lead to a breakout towards the $26-$26.50 area and levels from October 2019. Support is at $25-$24.75.

iShares MSCI Emerging Markets ETF (EEM, $53.57, down $0.80)
EEM May 55 calls (EEM210521C00055000, $0.65, down $0.35)
Entry Price: $1.00 (4/5/2021)
Exit Target: $2.00
Return: -35%
Stop Target: None
Action: Wednesday’s low tapped $53.38 with upper support at $53.50-$53 getting breached but holding. Resistance is at $54-$54.50.

Utz Brands (UTZ, $25.28, down $0.53)
UTZ May 25 calls (UTZ210521C00025000, $1.65, down $0.25)
Entry Price: $1.45 (3/29/2021)
Exit Target: $2.90
Return: 7%
Stop Target: $1.55 (Stop Limit)
Action: Shares traded to a high of $26.15 with the options tagging $2 before reversing course. The Stop Limit at $1.55 tripped on the fade to $25.18 afterwards with the calls touching a low of $1.54.
Although frustrating, we can look to reestablish a position if the 50-day moving average holds over the next few days.

International Game Tech (IGT, $16.40, down $0.80)
IGT April 20 calls (IGT210416C00020000, $0.05, down $0.05)
Entry Price: $0.95 (3/17/2021)
Exit Target: $1.90
Return: -95%
Stop Target: None
Action: Close the trade this morning to save the remaining premium. We can revisit IGT once shares recover and hold $17.50 and the 50-day moving average.

Pre-Market Update for 4/7/2021
Bulls Take a Breather
8:00am (EST)
The stock market traded in a tighter range on Tuesday before ending slightly lower as Wall Street took a breather following Monday’s record-setting rally. The blue-chips and small-caps showed the most weakness despite a strong JOLTS report with job openings climbing 268,000 to 7,370,000 in February.
While this underscored the increasingly good news on the economic recovery and the labor market, Wednesday’s update from the Fed minutes may have also played a role in keeping traders cautious.
The Russell 2000 tagged an opening high of 2,280 before going out at 2,259 (-0.3%). Near-term and lower resistance at 2,275-2,300 was breached but held for the second-straight session. A close above the latter would suggest ongoing strength towards 2,325-2,350 with the mid-March record peak at 2,360. Below is a chart of the IWM.
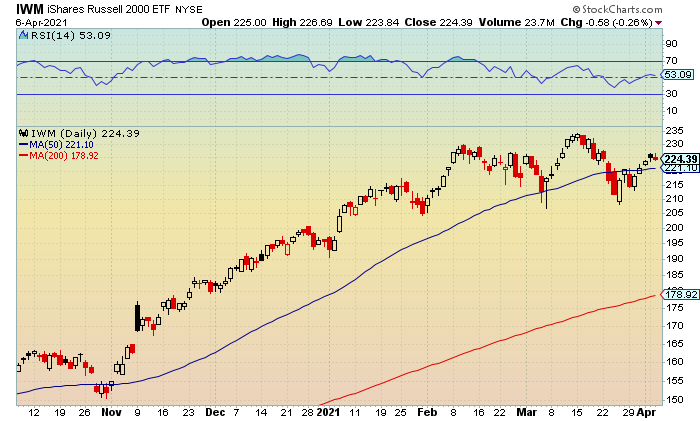
The Dow traded to an afternoon low of 33,380 before closing at 33,430 (-0.3%). Fresh and upper support at 33,500-33,250 was breached and failed to hold. A move below the the latter would signal a further fade towards 33,000-32,750.
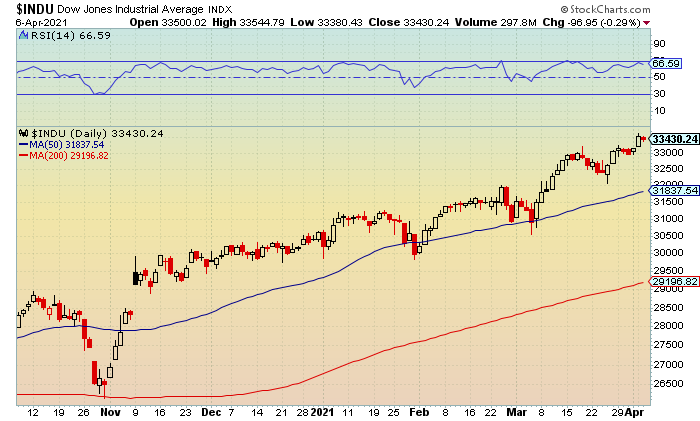
The Nasdaq finished at 13,698 (-0.1%) with the morning high hitting 13,776. Current and lower resistance at 13,750-13,900 was cleared but held. A close above the latter would indicate a retest towards 14,000-14,150 with the mid-February all-time peak at 14,175.
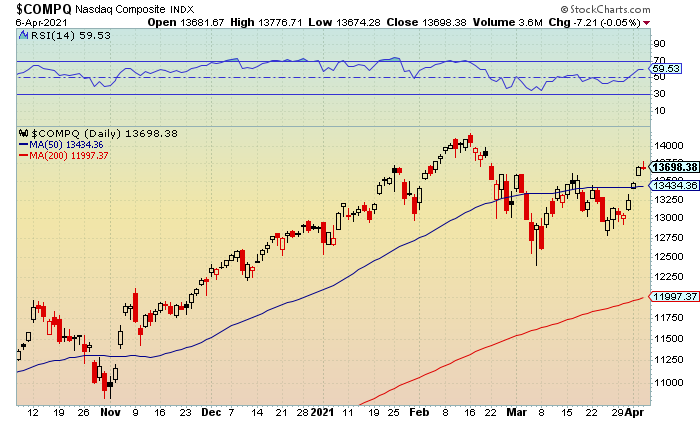
The S&P 500 tagged its fourth-straight all-time high after reaching 4,086 before settling slightly down at 4,073 (-0.1%). Near-term and lower resistance at 4,100-4,125 was challenged but held. A close the latter would suggest additional breakout potential towards 4,150-4,175.
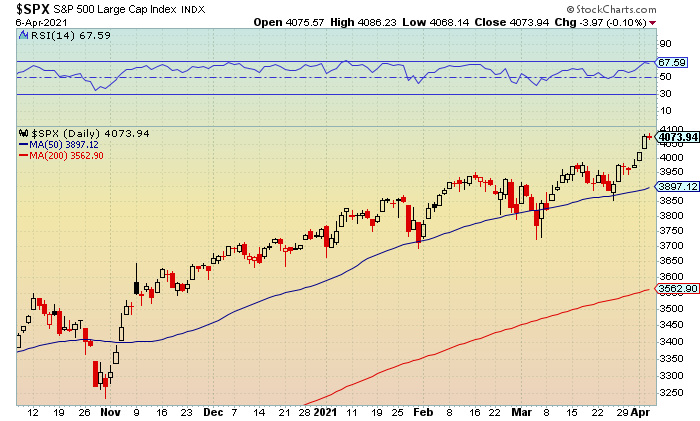
Market Movers
Romeo Power (RMO) surged 60% after announcing a long-term supply agreement with Paccar (PCAR). However, Romeo Power recently noted that global demand for battery cells has sharply outpaced supply, which is driving a cell shortage and was the cause of the roughly 80% cut to their 2021 revenue target.
Volatility Index
The iPath S&P Vix Short-Term Futures (NYSEArca: VIX) was up for the second-straight session with the intraday peak hitting 18.30. Near-term and lower resistance at 18-18.50 was cleared and held. A close above the latter would indicate a retest towards 19.50-20.
Support is at 17.50-17 with last Friday’s 52-week low at 17.29.
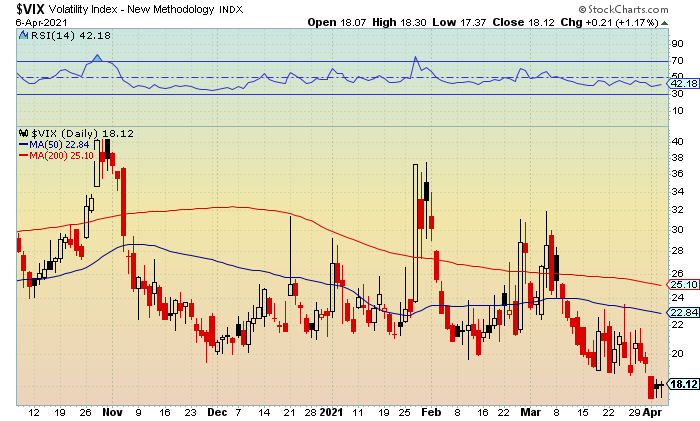
Market Analysis
The Spiders Dow Jones Industrial Average ETF (NYSE: DIA) was down for the first time in three sessions with the afternoon low tapping $333.78. Current and upper support at $334-$333.50 was tripped but held. A close below the latter would signal weakness towards the $332.50-$332 area.
Resistance is at $335.50-$336 with Monday’s all-time top at $336.15.
RSI is in a slight downtrend with key support at 65 holding. A move below this level would indicate additional weakness towards 60-55. Key resistance is at 70 and a level that has been holding since last November.
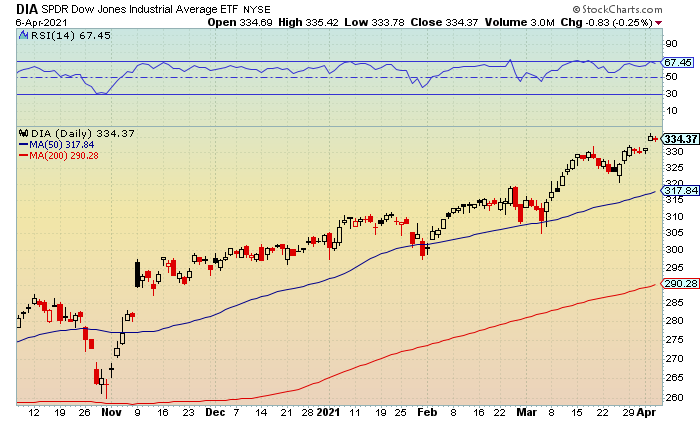
Sector
The Health Care Select Sector SPDR Fund (NYSE: XLV) remains in a six-session trading range with the intraday low reaching $116.58. Near-term and upper support at $117-$116.50 failed to hold. A close below the latter would signal weakness towards $115.50-$115 and the 50-day moving average.
Resistance is at $117.50-$118 with the late January all-time high at $118.99.
RSI is in a slight downtrend with upper support at 55-50 holding. A close below the latter would indicate additional weakness towards 45-40 and levels from early March. Resistance is at 60-65.
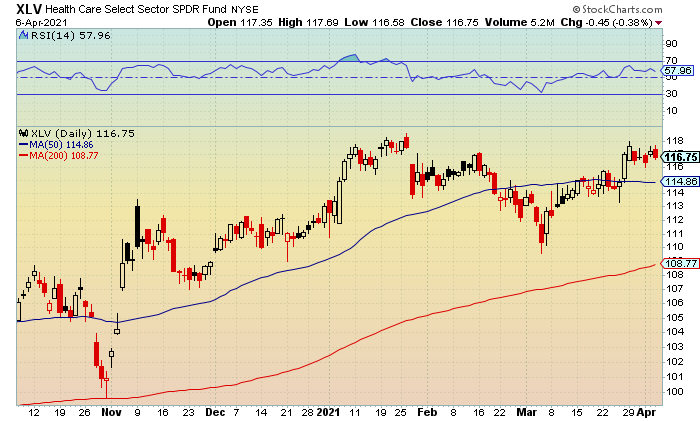
Market Outlook
The market could be a bit more volatile in the afternoon once the Fed minutes are released as inflation worries are on the rise. This has led to some speculation that the Fed may be forced to temper its ultra-accommodative policy sooner than policymakers are predicting. The bond market will be the key in today’s late action with many traders focusing on the 10-year yield.
Options Play List
iShares MSCI Emerging Markets ETF (EEM, $54.37, up $0.30)
EEM May 55 calls (EEM210521C00055000, $1.00, up $0.05)
Entry Price: $1.00 (4/5/2021)
Exit Target: $2.00
Return: 0%
Stop Target: None
Action: Tuesday’s high touched $54.60 with prior and lower resistance from mid-March $54.50-$55 getting breached but holding. A close above the latter and the 50-day moving average would be a bullish development for additional upside towards $55.50-$56. Support is at $54-$53.50.
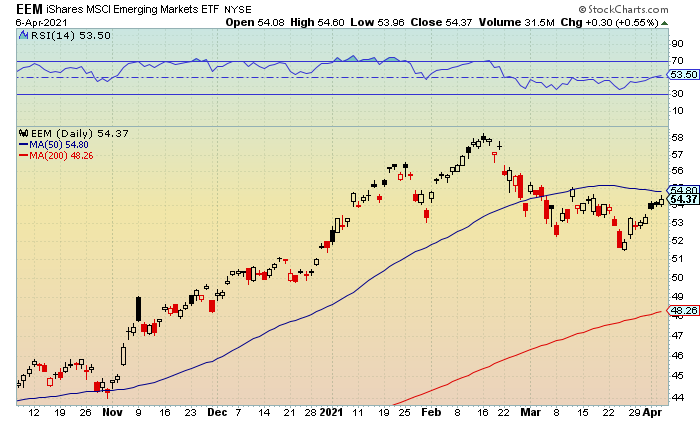
Utz Brands (UTZ, $25.81, up $0.30)
UTZ May 25 calls (UTZ210521C00025000, $1.90, up $0.15)
Entry Price: $1.45 (3/29/2021)
Exit Target: $2.90
Return: 31%
Stop Target: $1.55 (Stop Limit)
Action: Set an initial Stop Limit at $1.55 to start protecting profits and to avoid a loss.
Shares tagged a high of $25.88 with prior and lower resistance at $25.75-$26 getting recovered. A close above the latter would likely signal additional strength towards $26.25-$26.50. Support remains at $25.25-$25 and the 50-day moving average.
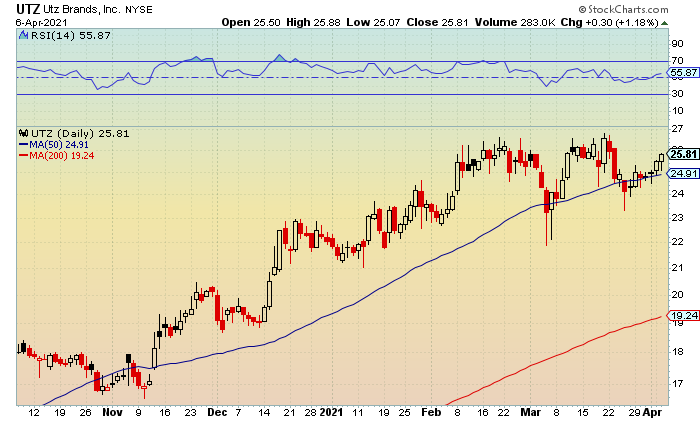
International Game Tech (IGT, $17.20, up $0.67)
IGT April 20 calls (IGT210416C00020000, $0.10, unchanged)
Entry Price: $0.95 (3/17/2021)
Exit Target: $1.90
Return: -89%
Stop Target: None
Action: Yesterday’s peak hit $17.25 with lower resistance at $17.25-$17.50 getting kissed but holding. Slightly rising support is at $16.75-$16.50.
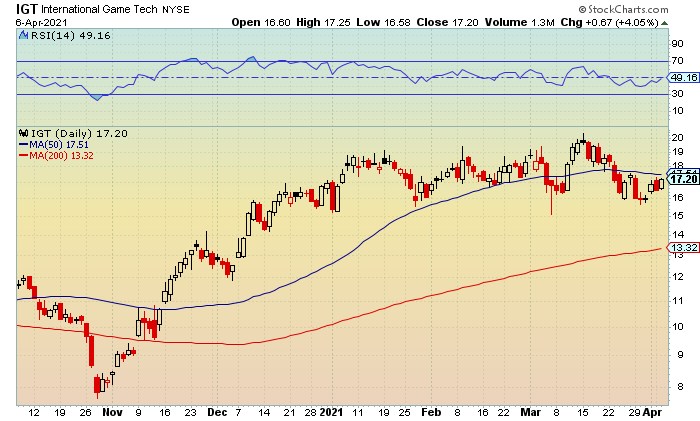
Pre-Market Update for 4/6/2021
Dow and S&P 500 Touch Another Round of Record Highs
8:00am (EST)
The stock market had a strong showing on Monday following a blowout employment report on Friday, which revealed the economy added a stunning 916,000 jobs last month with the unemployment rate falling to 6%. Better-than-expected economic news also fueled bullish sentiment and comes ahead of a busy week for Fed speak.
The Nasdaq tested an intraday peak of 13,720 before ending at 13,705 (+1.7%). Prior and lower resistance from early February at 13,600-13,750 was recovered. A move above the latter would indicate additional strength towards 13,850-14,000.
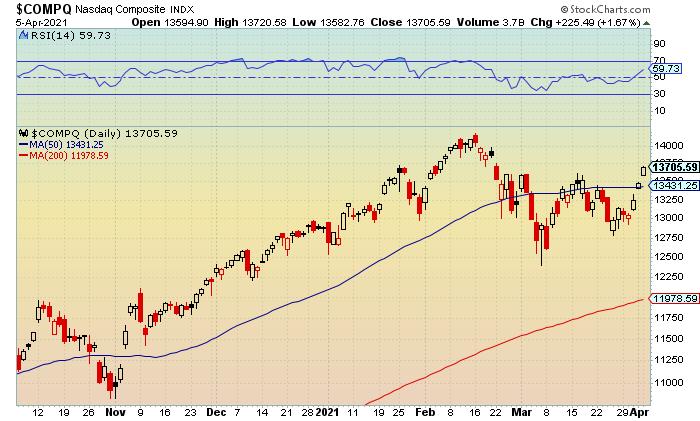
The S&P 500 tapped another all-time and midday high of 4,083 before settling at 4,077 (+1.4%). New and lower resistance at 4,075-4,100 was cleared and held. A close the latter would suggest ongoing momentum towards 4,125-4,150.
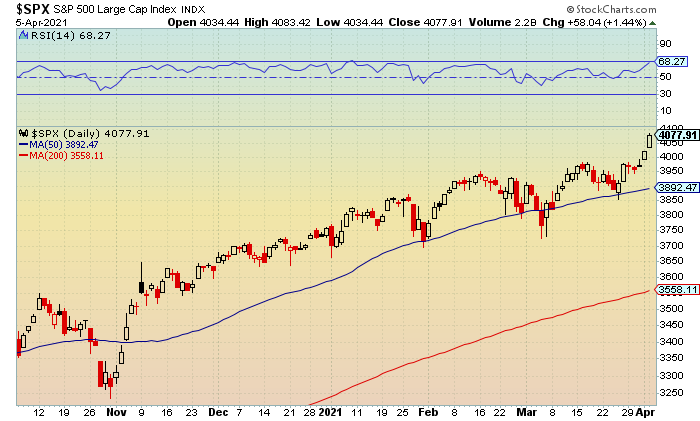
The Dow traded to a fresh all-time high of 33,617 before finishing at 33,527 (+1.1%). Unchartered territory and lower resistance at 33,500-33,750 was tripped and held. A pop above the latter would signal additional upside towards 34,000-34,250.
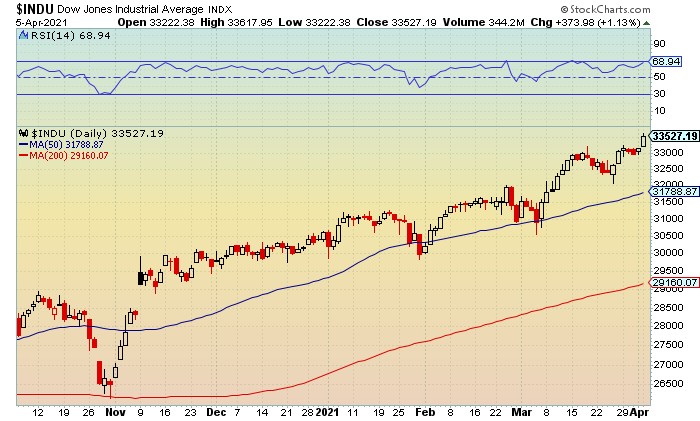
The Russell 2000 tagged an opening high of 2,280 before going out at 2,264 (+0.5%). Near-term and lower resistance at 2,275-2,300 was breached but held. A close above the latter would indicate ongoing strength towards 2,325-2,350 with the mid-March record peak at 2,360. Below is a chart of the IWM.
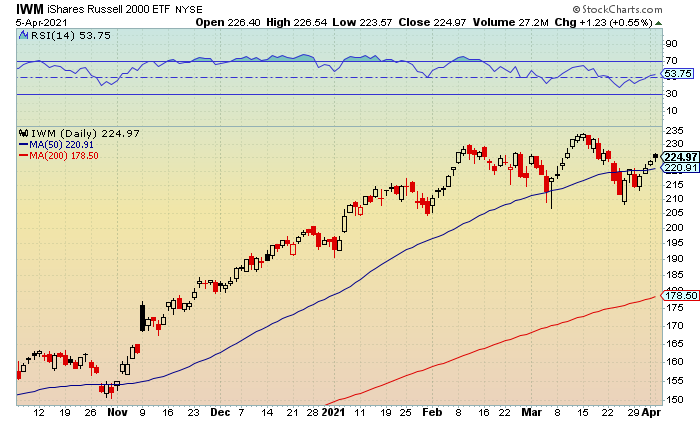
Market Movers
Nano-X Imaging (NNOX) zoomed 17% after announcing its digital X-ray device has received 510(k) clearance from the Food and Drug Administration. The company’s CEO said they remain on track to commence system shipments in the fourth quarter of this year and the first quarter of 2022 with the goal of finalizing deployment of the initial 15,000 Nanox.ARC systems by the end of 2024.
Volatility Index
The iPath S&P Vix Short-Term Futures (NYSEArca: VIX) snapped a three-session losing streak despite testing an opening low of 17.35. Near-term and upper support at 17.25-16.75 was challenged for the second-straight session. A close below the latter would indicate additional weakness towards 16-15.50.
The bounce to 18.40 afterwards cleared but failed to hold lower resistance at 18-18.50. A move above the latter would suggest a retest towards 19.50-20.
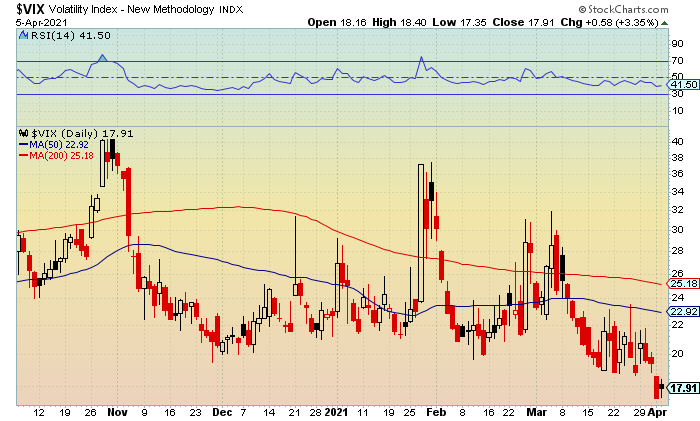
Market Analysis
The Spider Small-Cap 600 ETF (NYSE: SLY) extended its winning streak to four-straight sessions following the intraday push to $96.37. Prior and lower resistance from early March at $96-$96.50 was breached but held. A close above the latter would signal additional upside towards $97.50-$98.
Support is at $95-$94.50 followed by $93.50-$93.
RSI (relative strength indicator) is in an uptrend with lower resistance at 55-60 getting cleared and holding. A move above the latter would suggest additional strength towards 65-70 and levels from mid-March. Key support is at 50.
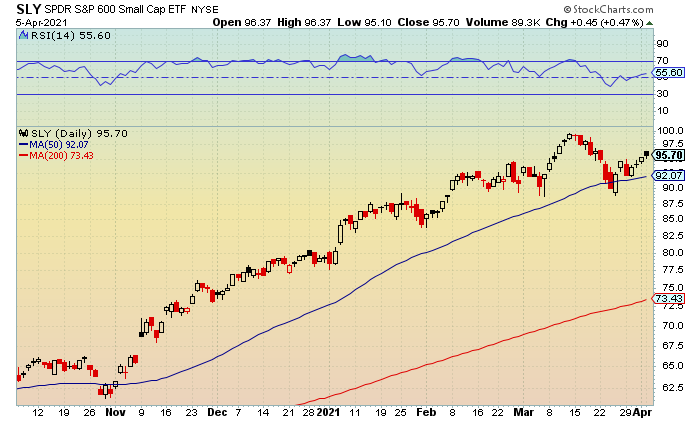
Sector
The Consumer Discretionary Select Spiders (NYSE: XLY) was also higher for the fourth-straight session after zooming to an afternoon and all-time peak of $173.90. Prior and lower resistance from early February at $173.50-$174 was tripped but held. A close above the latter would likely indicate a further breakout towards $175.50-$176.
New support is at $172-$171.50 followed by $170-$169.50.
RSI remains in a strong uptrend with key resistance at 60 getting recovered. Continued closes above this level would suggest a retest towards 65-70 with the latter holding since mid-January. Support is at 55-50 on a move back below 60.
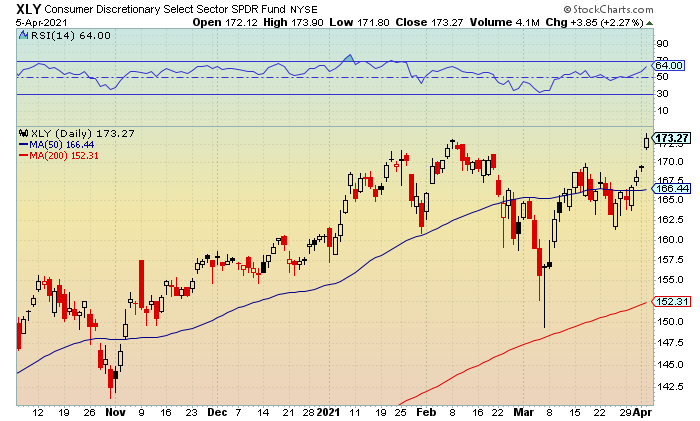
Market Outlook
The breakouts in the Dow and S&P 500, along with the momentum in the Nasdaq and small-caps, remain bullish developments. However, the action in the VIX on Monday was a slight concern but nothing too alarming.
The Fed minutes will take center stage on Wednesday with Fed Chair Powell speaking on Thursday at an International Monetary Fund panel on the global economy. On Monday, Treasury Secretary stated the U.S. Treasury Department is working with other major nations to agree on a global minimum corporate tax rate, which would disincentivize companies from seeking to locate to regions with lower tax rates.
There are also a batch of earnings on Thursday that are worth watching as Apogee Enterprises (APOG), Conagra Brands (CAG), Constellation Brands (STZ), Levi Strauss & Co. (LEVI), PriceSmart (PSMT) and WD-40 (WDFC) will be reporting numbers. This comes ahead of next week’s official start to the first-quarter earnings season with the Financial sector coming into focus.
Options Play List
iShares MSCI Emerging Markets ETF (EEM, $54.07, up $0.21)
EEM May 55 calls (EEM210521C00055000, $0.95, up $0.06)
Entry Price: $1.00 (4/5/2021)
Exit Target: $2.00
Return: -5%
Stop Target: None
Action: Shares tested a morning high of $54.25 with current and lower resistance at $54-$54.50 getting cleared and holding. A close above $54.75 and the 50-day moving average would be a more bullish signal for additional strength towards $55-$55.50. Support is at $53.50-$53.
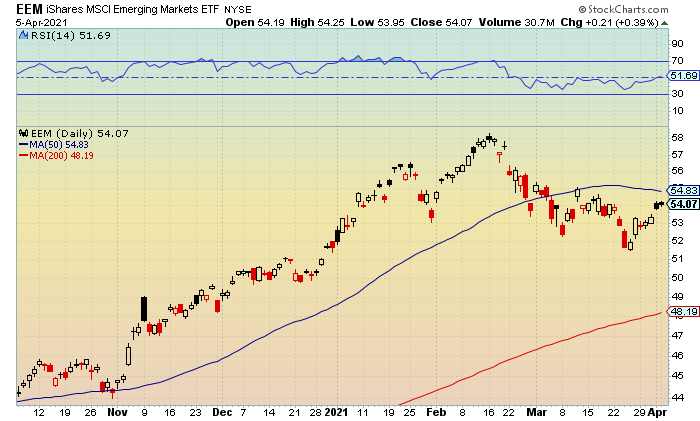
Utz Brands (UTZ, $25.51, up $0.51)
UTZ May 25 calls (UTZ210521C00025000, $1.75, up $0.25)
Entry Price: $1.45 (3/29/2021)
Exit Target: $2.90
Return: 21%
Stop Target: None
Action: Monday’s peak reached $25.55 with early March and lower resistance at $25.50-$25.75 getting recovered. A close above the latter would likely signal a run towards $26.25-$26.50. Rising support is at $25.25-$25 and the 50-day moving average.
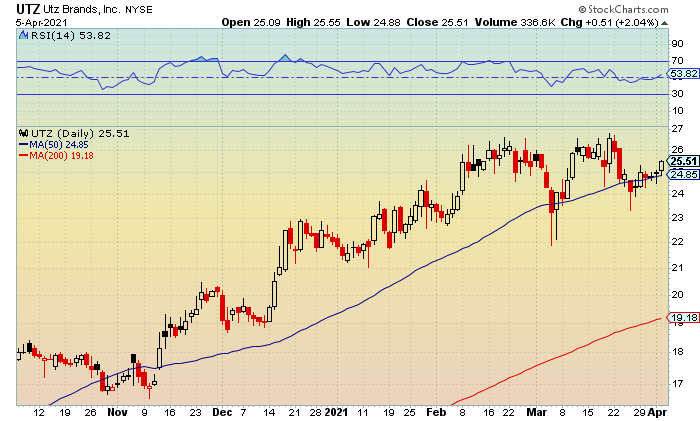
International Game Tech (IGT, $16.53, down $0.32)
IGT April 20 calls (IGT210416C00020000, $0.10, unchanged)
Entry Price: $0.95 (3/17/2021)
Exit Target: $1.90
Return: -89%
Stop Target: None
Action: Shares traded to a first half high of $17.29 before closing in the red. Near-term and lower resistance at $17.25-$17.50 was cleared but held. Support remains at $16.50-$16.25.
If shares fail to clear and hold the 50-day moving average by Thursday or Friday, we will likely exit the trade. We are going to need shares to make a run towards $21 this week like they did during a four-day run back in mid-March just to get back to even.
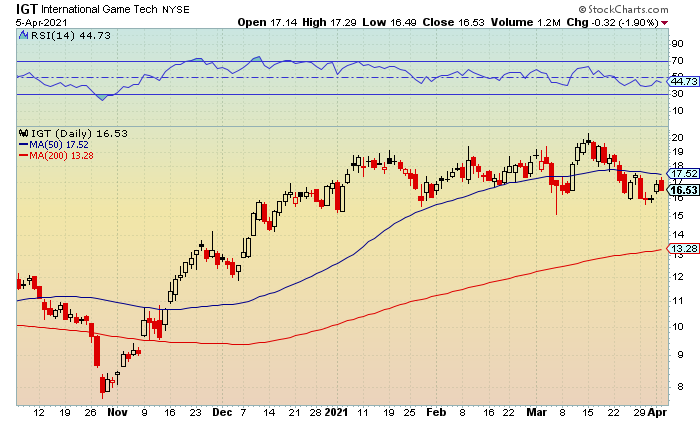
Pre-Market Update for 4/5/2021
S&P 500 Clears 4,000 Level/ Trade Alert (F)
8:00am (EST)
The stock market showed continued momentum on Thursday as the major indexes started off April with solid gains. Better-than-expected economic news and fresh details of President Biden’s $2.3 trillion infrastructure plan fueled bullish sentiment.
Technology led the surge higher with the Nasdaq clearing and holding a key level of resistance while the S&P 500 set another all-time closing high. The blue-chips are also on the verge of fresh record highs as volatility fell to its lowest level since February 2020.
The Nasdaq settled at 13,480 (+1.8%) after trading to a second half high of 13,487 while closing back above its 50-day moving average. Prior and lower resistance at 13,450-13,600 was cleared and held. A close above the latter would suggest additional momentum towards 13,650-13,800.
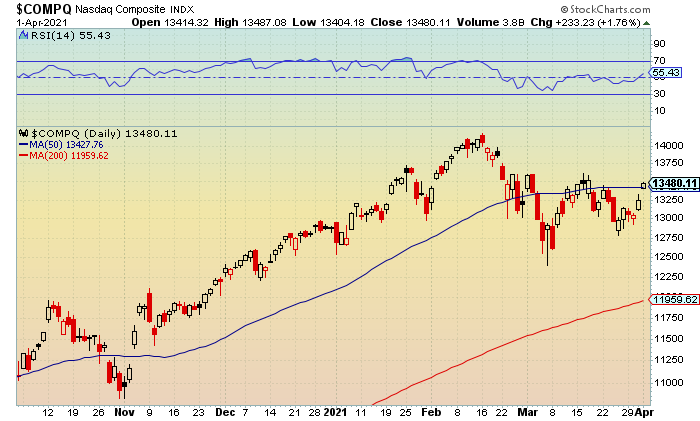
The Russell 2000 finished on its session peak of 2,253 (+1.5%). Prior and lower resistance at 2,250-2,275 was recovered. A move above the latter would signal additional upside towards 2,300-2,325. Below is a chart of the IWM.
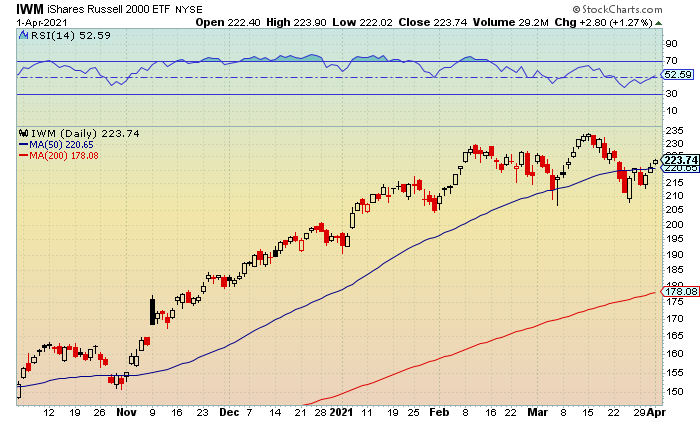
The S&P 500 closed at 4,019 (+1.2%) with the new intraday record high hitting 4,020. Unchartered territory and lower resistance at 4,000-4,025 was cleared and held. A pop the latter would indicate ongoing strength towards 4,050-4,075.
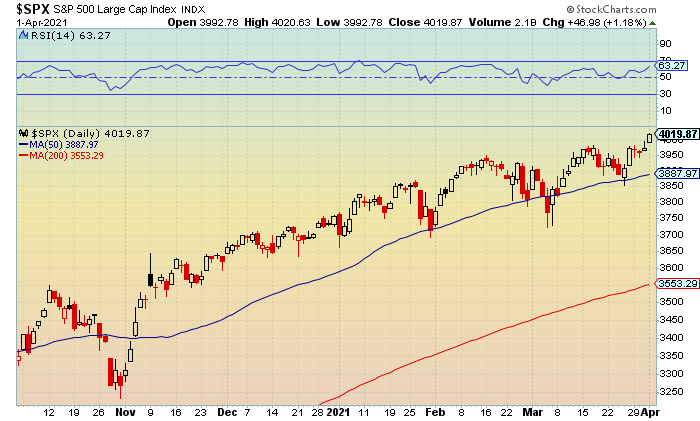
The Dow made an late day run to 33,167 before ending at 33,153 (+0.5%). Near-term and lower resistance at 33,000-33,250 was recovered. A close above the latter and the all-time high of 33,259 would suggest a breakout towards 33,500-33,750.
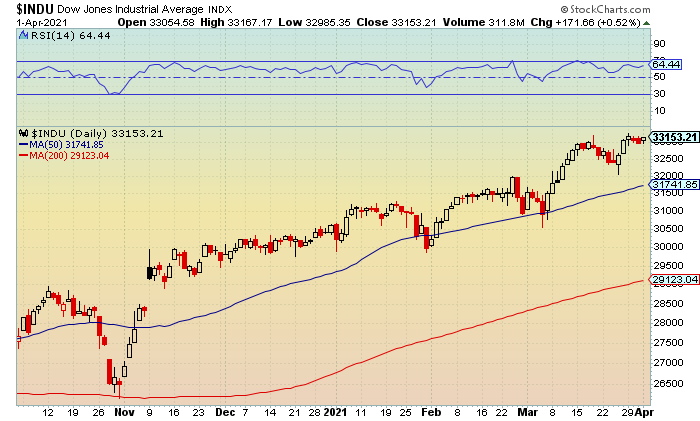
Market Movers
Shares of Velodyne Lidar (VLDR) jumped 12% after the company announced a multi-year agreement with AGM Systems, which provides analysis of air and mobile mapping data.
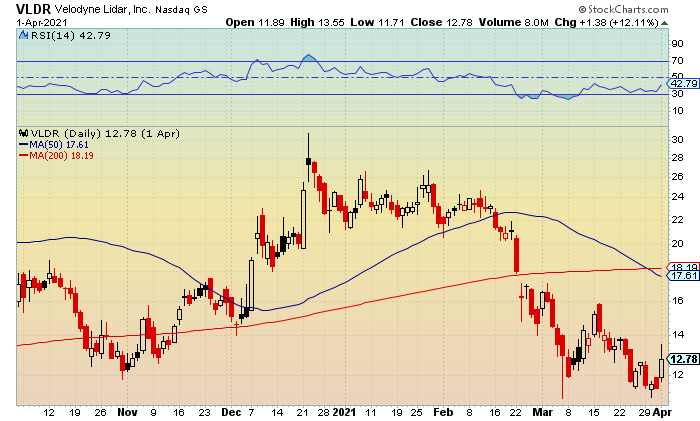
Volatility Index
The iPath S&P Vix Short-Term Futures (NYSEArca: VIX) extended its losing streak to three-straight sessions after tapping a fresh 52-week low of 17.29. Upper support from February 2020 at 17.50-17 was breached and held. A close below the latter would indicate ongoing weakness towards 16-15.50.
Lowered resistance is at 18-18.50 followed by 19.50-20.
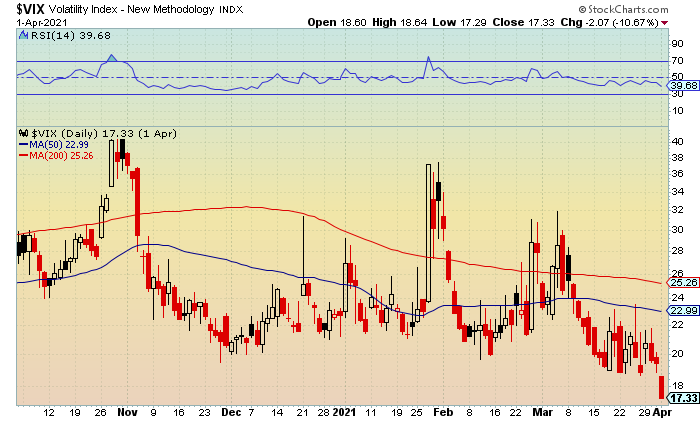
Market Analysis
The S&P 400 Mid Cap Index (NYSE: MID) was up for the third-straight session after closing on the session high of 2,647. Prior and lower resistance at 2,625-2,650 was recovered. A move above the latter would indicate additional strength towards 2,675-2,700 with the mid-March double top all-time high at 2,682.
Fresh support is at 2,600-2,575 followed by 2,550-2,525 and the 50-day moving average.
RSI (relative strength index) is in an uptrend with key resistance at 60 holding. A move above this level would signal strength towards 65-70 and the latter holding since mid-February. Support is at 55-50.
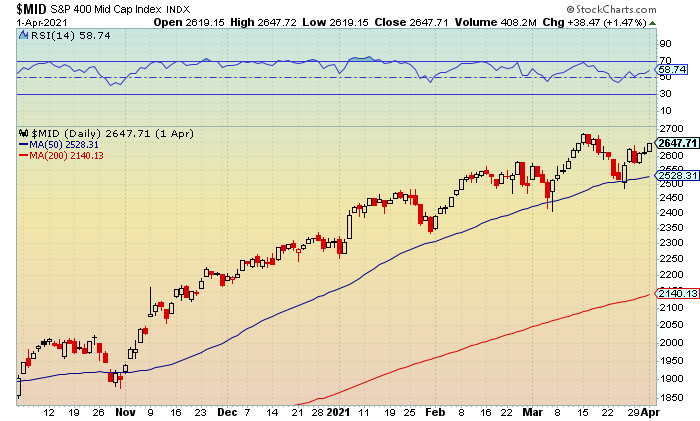
Sector
The Dow Jones Transportation Average (NYSE: TRAN) rebounded with the intraday high hitting 14,754. Key resistance at 14,750 was breached but held. A close above this level would indicate additional momentum towards 14,850-15,000 and fresh all-time highs.
Current support is at 14,650-14,500.
RSI is in a slight uptrend with key resistance at 70 holding. A close above this level would signal additional strength towards 75-80 and the highs from last August. Support is at 60.
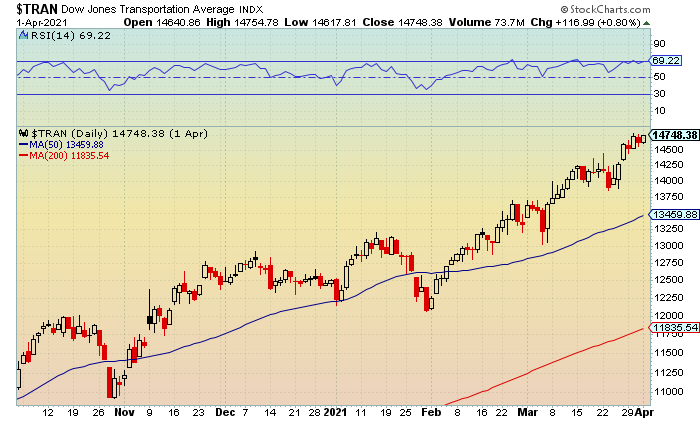
Market Outlook
The stock market has ended April higher in 14 out of the past 15 years, and since 1950, it has been the second best month for stocks. Heading into the second quarter, sector leadership has moved strongly in favor of cyclical and value stocks, and away from Tech, for the most part. A lot of this has to do with the broad-based reopening of business across the U.S. economy.
The Energy, Financials and Industrials sectors have outperformed year-to-date, while last year’s winners such as the Technology and Communication Services sectors have lagged by comparison. While analysts believe this trend will continue this quarter, the strong moves in the Nasdaq (and small-caps) last week shouldn’t be ignored.
The first quarter earnings season will begin in the next week or so and the catalyst for higher highs and a breakout to continued all-time highs look good. The one warning sign of trouble ahead will be if the VIX starts to move back up and clears the 20 level. On that note, I could have new trades as early as today so stay locked-and-loaded in case I take action.
Options Play List
Utz Brands (UTZ, $25.00, up $0.21)
UTZ May 25 calls (UTZ210521C00025000, $1.50, unchanged)
Entry Price: $1.45 (3/29/2021)
Exit Target: $2.90
Return: 3%
Stop Target: None
Action: Shares kissed a high reached $25.06 with lower resistance at $25-$25.25 getting cleared and holding. A close above the latter and last week’s peak at $25.31 should get the $26 area back in play. Support is at $24.75-$24.50 and the 50-day moving average.
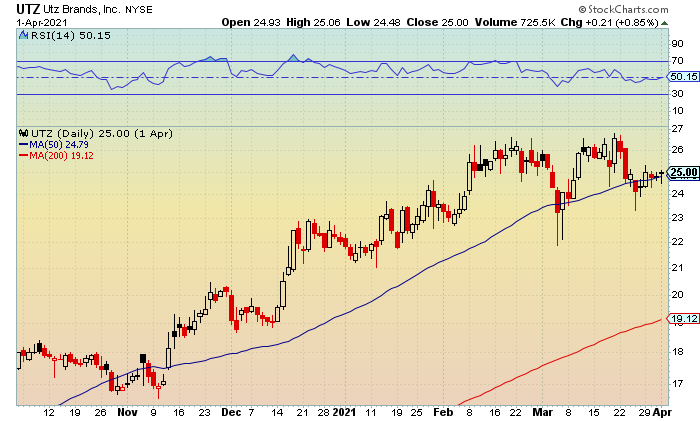
International Game Tech (IGT, $16.85, up $0.80)
IGT April 20 calls (IGT210416C00020000, $0.10, unchanged)
Entry Price: $0.95 (3/17/2021)
Exit Target: $1.90
Return: -89%
Stop Target: None
Action: Thursday’s high reached $17.12 with prior and lower resistance at $17-$17.25 getting cleared but holding. New support is at $16.50-$16.25.
The catalyst for this trade was the enormous call buying on the day we entered this position but momentum quickly faded afterwards. These options expire in 11 days so we will need to see some nice pin action and a recovery of the 50-day moving average early this week for this trade to have any chance of a comeback.
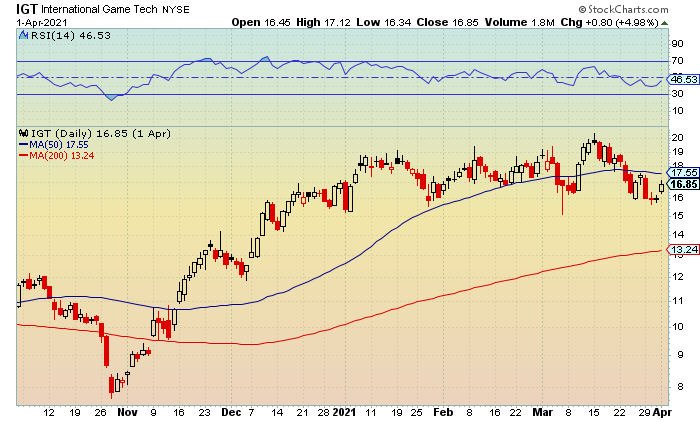
Ford Motor Company (F, $12.17, down $0.08)
F April 14 calls (F210416C00014000, $0.05, down $0.02)
Entry Price: $0.45 (3/8/2021)
Exit Target: $0.90
Return: -89%
Stop Target: None
Action: Close the trade this morning to save the remaining premium.
The only catalyst that might help this trade would be this month’s earnings’s announcement which will come after these call options expire. Although the percentage loss looks nasty, these were cheap options that failed to rebound as shares remains in a tight trading range. If shares rebound in the month’s ahead, and can recover the $13 level, perhaps will will revisit Ford.
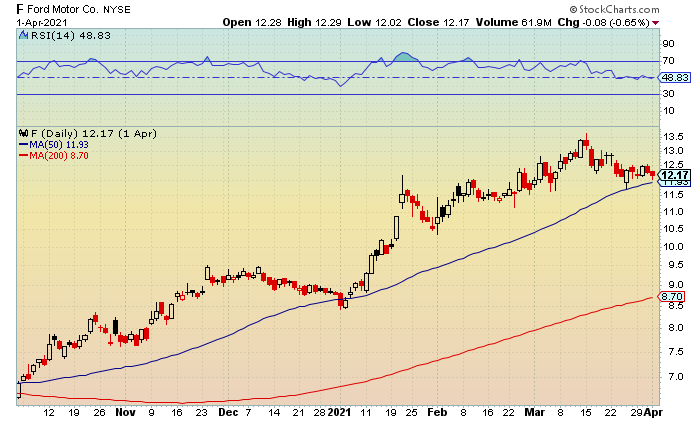
Pre-Market Update for 4/1/2021
S&P 500 Tags Fresh Record High
8:00am (EST)
The stock market closed mostly higher on Wednesday on the heels of President Biden’s infrastructure program that was unveiled in Pittsburg, PA. Estimates have the price tag at $2.3 trillion, with the program focused on infrastructure, housing, green energy and manufacturing.
While additional stimulus might be welcomed by Wall Street, the prospect of higher taxes needed to pay for it remains to be seen. The news helped push the S&P 500 to a new all-time high while Tech showed the most strength.
The Nasdaq traded to an intraday peak of 13,325 while ending at 13,246 (+1.5%). Prior and lower resistance at 13,300-13,450 was cleared but held. A close above the latter and the 50-day moving average would signal additional upside towards 13,500-13,650.
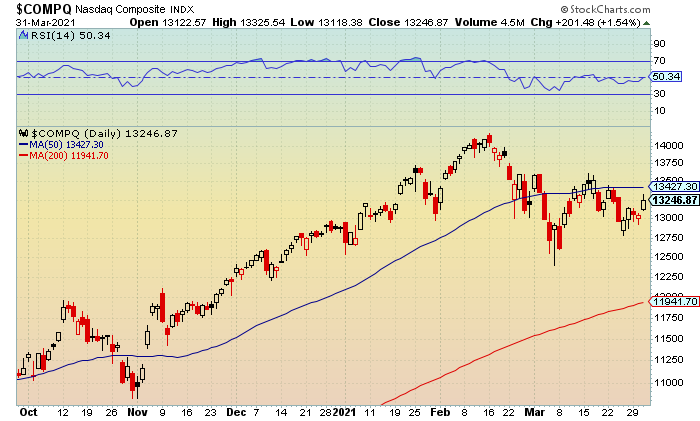
The Russell 2000 closed at 2,220 (+1.1%) after testing a second half high of 2,237 while closing back above its 50-day moving average. Current and lower resistance at 2,225-2,250 was breached but held. A pop above the latter would suggest ongoing strength towards 2,275-2,300. Below is a chart of the IWM.
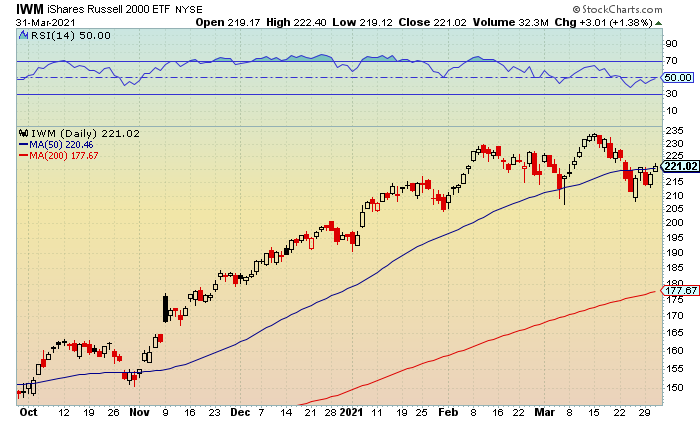
The S&P 500 tagged a fresh record high of 3,994 before settling at 3,972 (+0.4%). Unchartered territory and lower resistance at 3,975-4,000 was cleared but failed to hold. A move the latter would indicate a further breakout towards 4,025-4,050.
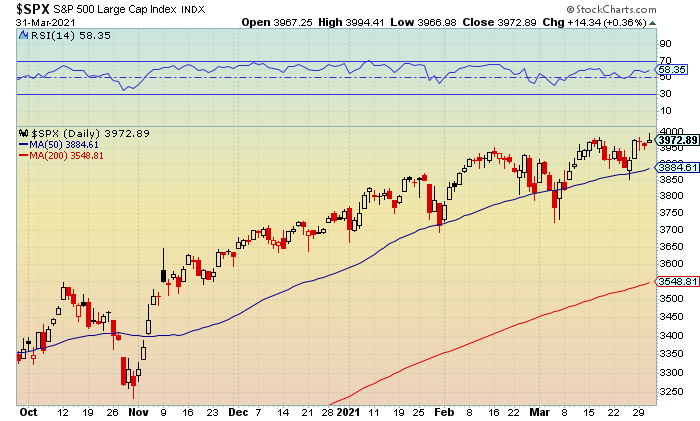
The Dow finished at 32,981 (-0.3%) with the late day low hitting 32,980. Key support at 33,000 failed to hold. Continued closes below this level keeps downside risk towards 32,750-32,500 in play.
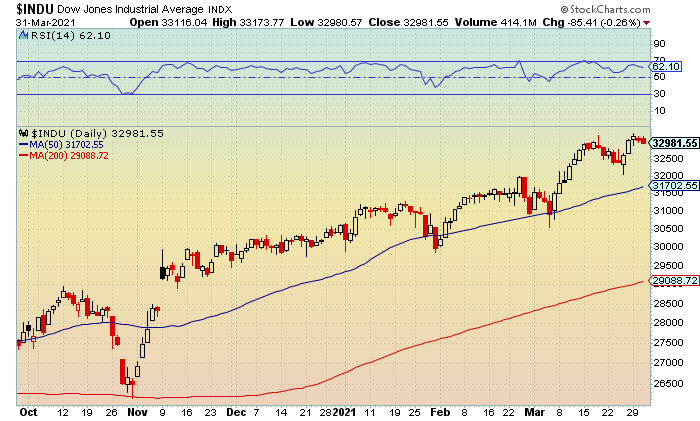
Market Movers
Shares of Conn’s (CONN) soared 24% following the company’s fourth-quarter earnings results. The speciality retailer reported a profit of 91 cents a share on revenue of $367 million versus forecasts for 23 cents a share on revenue of $328 million.
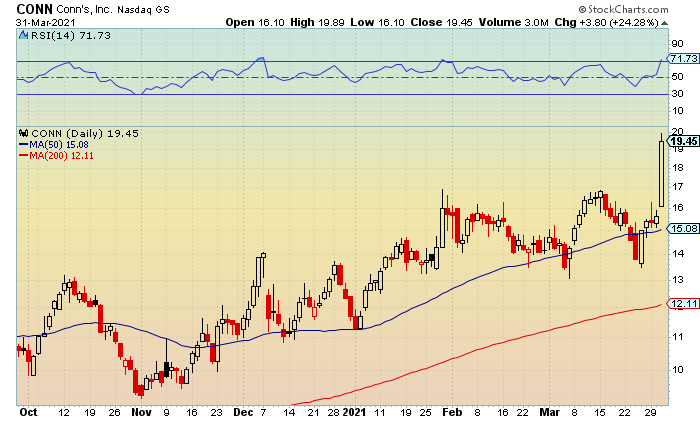
Volatility Index
The iPath S&P Vix Short-Term Futures (NYSEArca: VIX) was down for the second-straight session with the intraday low reaching 18.85. Current and upper support at 19-18.50 was breached but held. A close below the latter and last Friday’s 52-week low of 18.68 would signal additional weakness towards 17.50-17.
Lowered resistance is at 20-20.50 followed by 21.50-22.
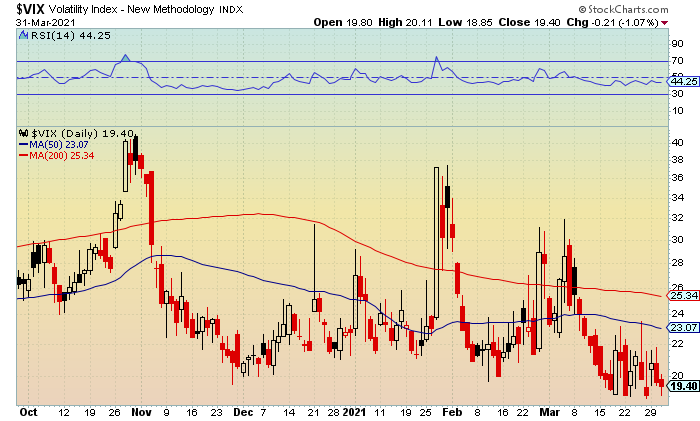
Market Analysis
The Invesco QQQ Trust (Nasdaq: QQQ) snapped a two-session slide with the midday high kissing $320.74. Prior and lower resistance at $320.50-$321 was cleared but held. A close above the latter and the 50-day moving average would suggest further upside towards $322-$322.50.
Current support is at $318-$317.50 followed by $316-$315.50.
RSI (relative strength indicator) is back in an uptrend after clearing and holding key resistance at 50. Continued closes above this level would indicate additional strength towards 55-60. Support is at 45-40.
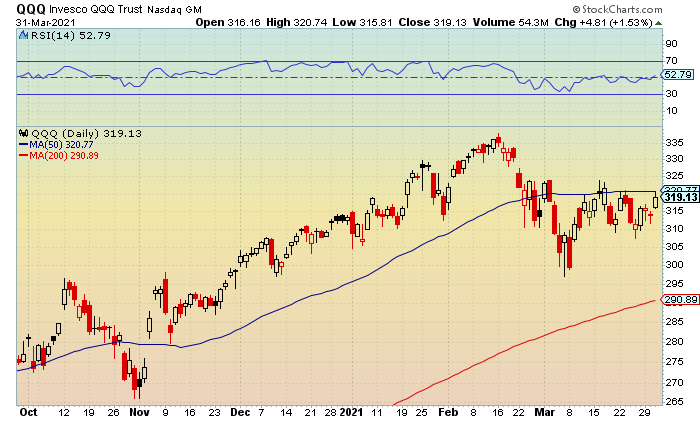
Sector
The Consumer Staples Select SPDR Fund (NYSE: XLP) was down for the second-straight session after trading to a low of $68.16. Current and upper support at $68.50-$68 was tripped and failed to hold. A close below the latter would indicate additional weakness towards $67.50-$67.
Resistance is at $69-$69.50 with the recent all-time high of $69.33.
RSI has flatlined with key support at 70 failing to hold. Continued closes below this level would suggest downside pressure towards 65-60. Resistance is at 70.
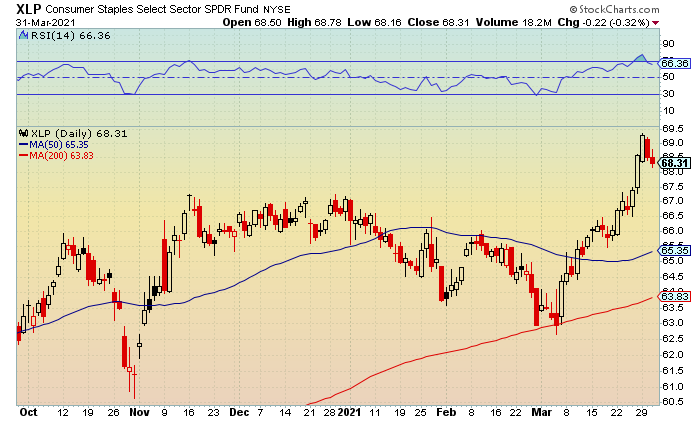
Market Outlook
The strength in the S&P 500 and Nasdaq were bullish developments heading into the month of April. The Dow is also on the verge of possibly breaking out to new record highs and the small-caps recovery of its 50-day moving average was also a bullish signal.
I mentioned that April is typically a very bullish month for the market, especially for the Dow. Although historically, April is prone to weakness after the mid-month tax deadline, this has been moved out into May this year.
Friday’s jobs report with the market closed could be a wild card into how Monday and next week starts to unfold. However, expectations are it will be the best report in five months as vaccinations and business reopening’s boosted hiring in March.
With that said, our April positions are running out of time as there are two weeks left before expiration. Hopefully, a market rally can resume next week as the last few weeks of March led to some selling pressure. However, the current open positions still face uphill challenges and we will likely close out these trades next week.
The good news is there are a number of bullish setups I currently like that will carry us into May and possibly June. We closed March with four winners and one loser and for the year, my track record is at 14-3. I fully expect our new trades will make up for lost ground from the end of month weakness as a possible breakout for the major indexes comes into play.
Options Play List
Utz Brands (UTZ, $24.79, up $0.04)
UTZ May 25 calls (UTZ210521C00025000, $1.50, unchanged)
Entry Price: $1.45 (3/29/2021)
Exit Target: $2.90
Return: 3%
Stop Target: None
Action: Wednesday’s high reached $24.98 with lower resistance at $25-$25.25 getting challenged but holding. Support remains at $24.50-$24.25 on a close back below the 50-day moving average.
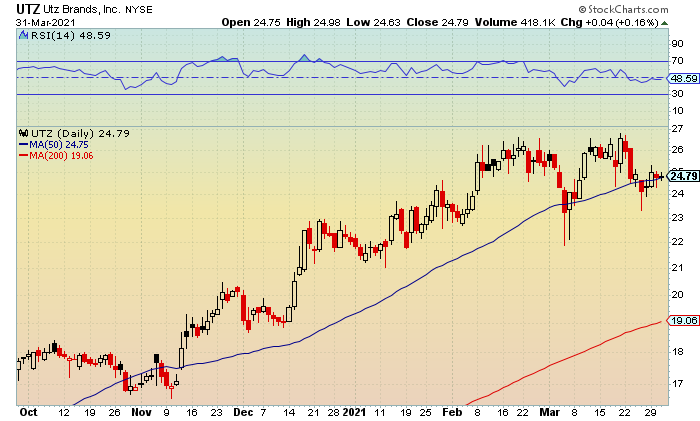
International Game Tech (IGT, $16.05, up $0.11)
IGT April 20 calls (IGT210416C00020000, $0.10, unchanged)
Entry Price: $0.95 (3/17/2021)
Exit Target: $1.90
Return: -89%
Stop Target: None
Action: Shares tested a high of $16.18 with lower resistance at $16-$16.25 getting cleared and holding. Support remains at $15.75-$15.50.
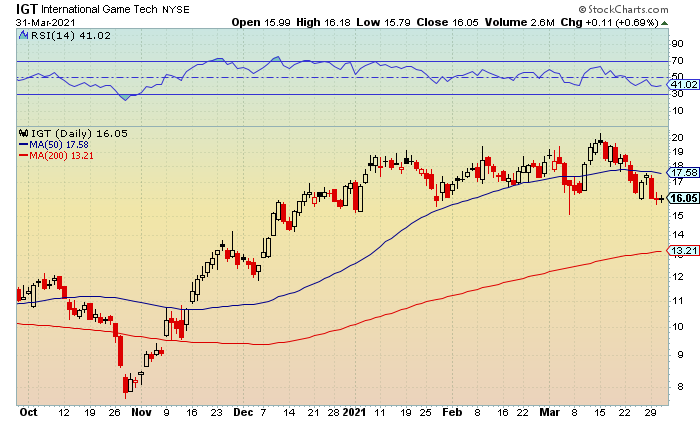
Ford Motor Company (F, $12.25, down $0.21)
F April 14 calls (F210416C00014000, $0.07, down $0.02)
Entry Price: $0.45 (3/8/2021)
Exit Target: $0.90
Return: -84%
Stop Target: None
Action: Yesterday’s low reached $12.21 with near-term and upper support at $12.30-$12.20 failing to hold. Resistance is at $12.40-$12.50.
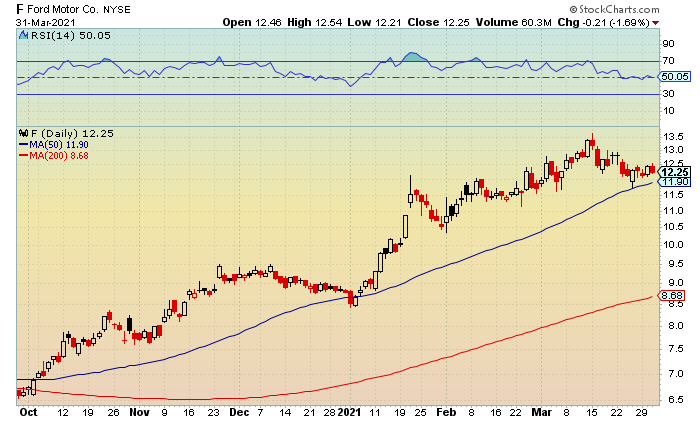
Pre-Market Update for 3/31/2021
Small-Caps Show Strength in Lackluster Action
8:00am (EST)
The stock market showed continued weakness on Tuesday despite a blowout consumer confidence number as rising rates once again weighed on Tech and the broader indexes. The Conference Board’s closely watched consumer confidence index increased to 109.7 in March from 90.4 in February, representing the highest level since the start of the pandemic.
Meanwhile, the benchmark 10-year Treasury yield rose to about 1.75% and a 14-month peak. Small-caps managed to show strength despite the crosswinds while volatility eased back towards prior support levels.
The Nasdaq closed at 13,045 (-0.1%) with the opening low hitting 12,922. Near-term and upper support at 13,000-12,850 was clipped but held for the second-straight session. A drop below the latter would indicate weakness towards 12,750-12,600.
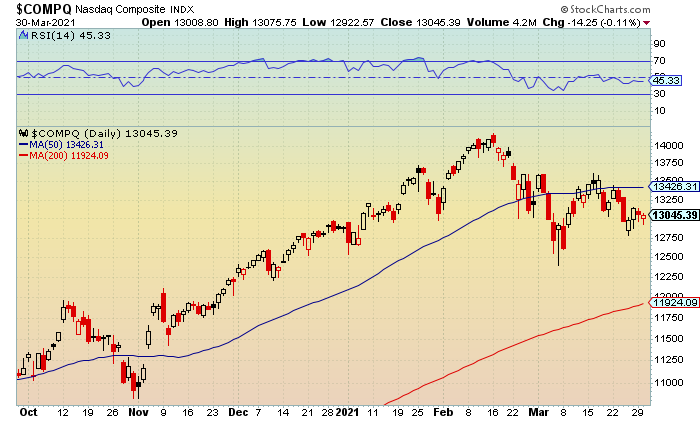
The Dow tested an intraday low of 32,988 before settling at 33,066 (-0.3%). Mid-month and upper support at 33,000-32,750 was breached but held. A move below the latter would signal a further slide towards 32,500-32,250.
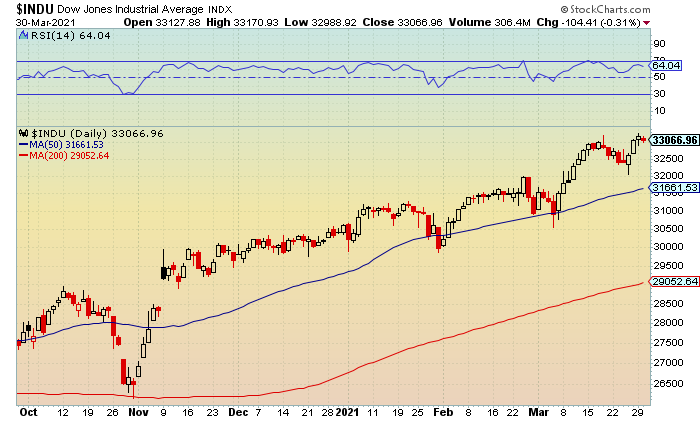
The S&P 500 traded to a first half low of 3,944 while ending at 3,958 (-0.3%). Current and upper support at 3,950-3,925 was breached but also held for the second-straight session. A close below the latter would suggest a further fade towards 3,900-3,875 and the 50-day moving average.
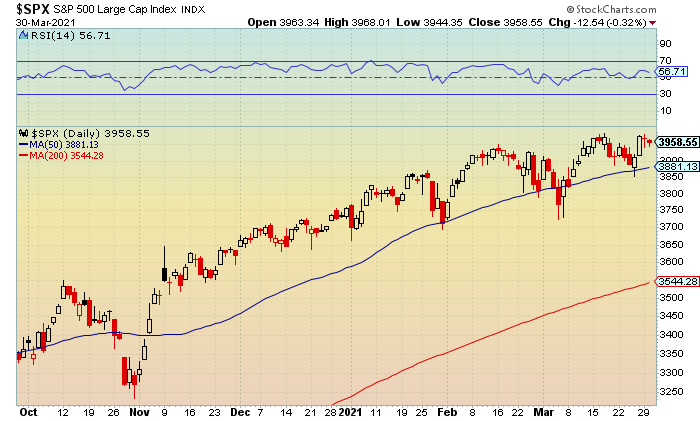
The Russell 2000 finished at 2,195 (+1.7%) after tapping an afternoon peak of 2,202. Prior and lower resistance at 2,200-2,25 was cleared but held. A move above the latter would signal another run towards 2,225-2,250. Below is a chart of the IWM.
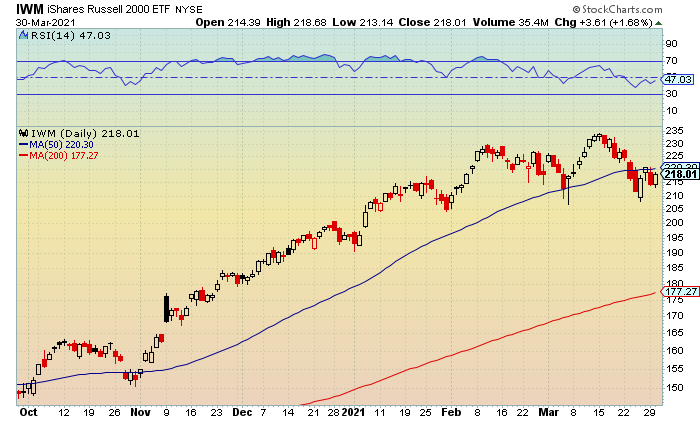
Market Movers
Shares of DXC Technology (DXC) rallied 9% following an analyst upgrade from Buy to Hold with a price target of $44, up from $28. The analyst believes the company looks poised for a strong fundamental rebound over the next year and beyond as channel checks point to considerably improved client service levels.
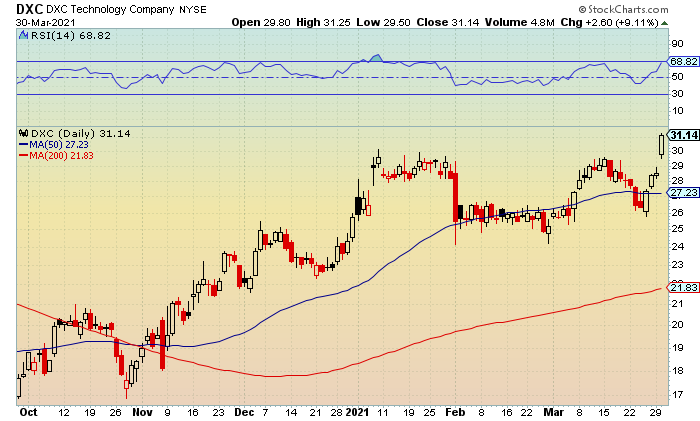
Volatility Index
The iPath S&P Vix Short-Term Futures (NYSEArca: VIX) fell for the third time in four sessions despite tagging an opening high of 21.75. Near-term and lower resistance at 21.50-22 was cleared but held. A close above the latter would suggest a retest towards 23-23.50 and the 50-day moving average.
Upper support at 19.50-19 was breached but held on the fade to 19.47 afterwards.
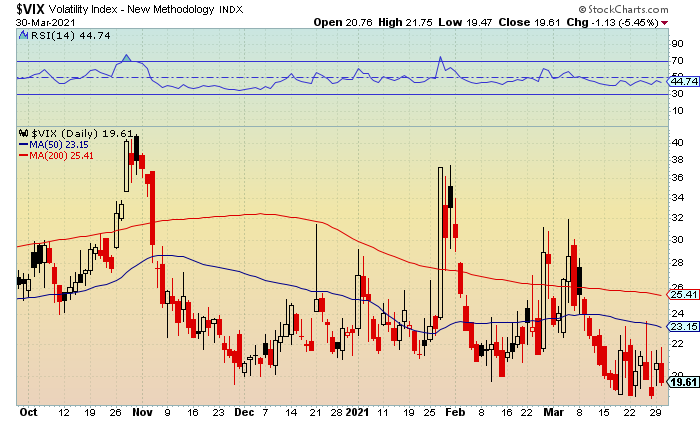
Market Analysis
The Wilshire 5000 Composite Index (NYSE: WLSH) fell for the second-straight session with the intraday low tapping 41,258. Current and upper support at 41,500-41,250 was tripped but held by a smidge. A move below the latter and the 50-day moving average would indicate a retest towards 41,000-40,750.
Resistance at 41,750-42,000.
RSI (relative strength index) is in a slight downtrend with key support at 50 holding. A close below this level would signal weakness towards 45-40 and lows from earlier this month. Resistance is at 55-60.
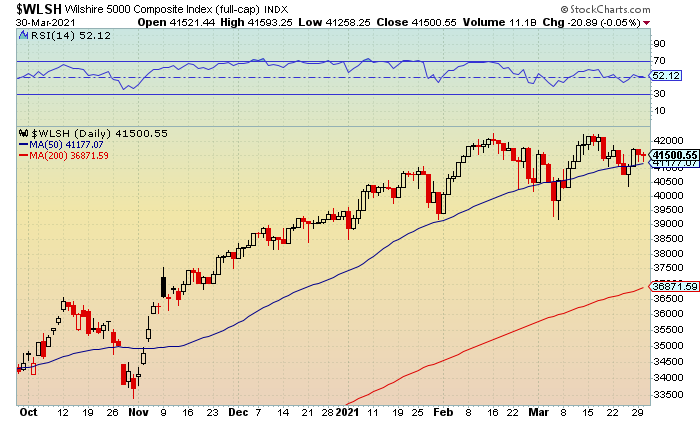
Sector
The SPDR Gold Shares (NYSE: GLD) plunged to a late day low of $157.55 to extend its losing streak to two-straight sessions. Prior and upper support from earlier this month at $158-$157.50 failed to hold. A close below the latter would signal additional downside risk towards $155.50-$155 and levels from last April.
Lowered resistance is at $158.50-$159 followed by $160-$160.50.
RSI is signaling oversold conditions with upper support at 30-25 holding. Resistance is at 35-40.
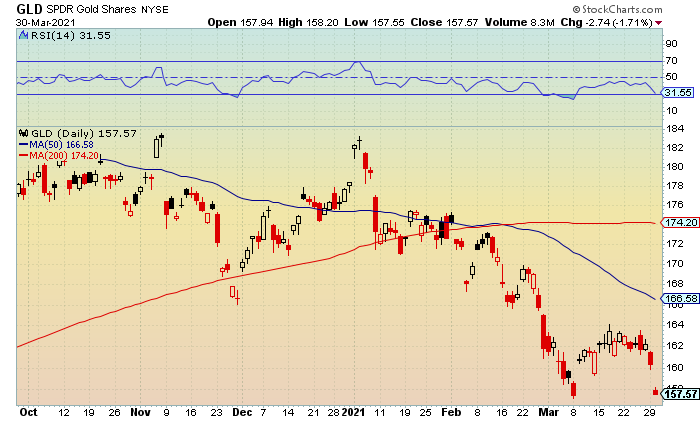
I have updated our current trades so let’s go check the tape.
Options Play List
Utz Brands (UTZ, $24.75, down $0.26)
UTZ May 25 calls (UTZ210521C00025000, $1.50, down $0.15)
Entry Price: $1.45 (3/29/2021)
Exit Target: $2.90
Return: 3%
Stop Target: None
Action: Shares traded to a first half low of $24.33 with near-term and upper support at $24.50-$24.25 and the 50-day moving average getting tripped but levels that held. Resistance is at $25-$25.25.
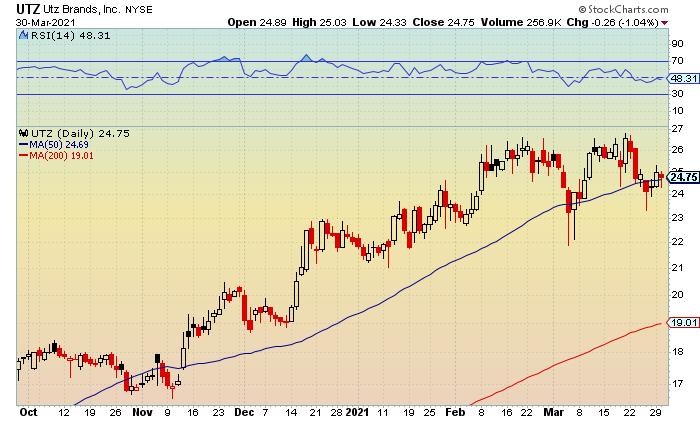
International Game Tech (IGT, $15.94, down $0.10)
IGT April 20 calls (IGT210416C00020000, $0.10, unchanged)
Entry Price: $0.95 (3/17/2021)
Exit Target: $1.90
Return: -89%
Stop Target: None
Action: Tuesday’s low hit $15.67 with upper support at $15.75-$15.50 getting clipped but holding. Resistance remains at $16.25-$16.50.
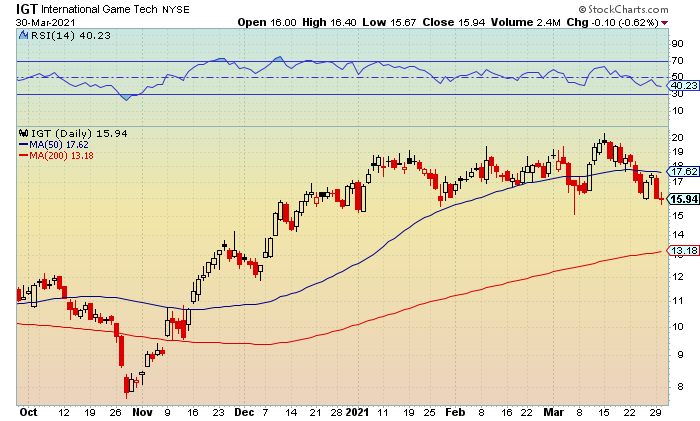
Ford Motor Company (F, $12.46, up $0.31)
F April 14 calls (F210416C00014000, $0.09, up $0.02)
Entry Price: $0.45 (3/8/2021)
Exit Target: $0.90
Return: -79%
Stop Target: None
Action: Shares rebounded to test a high of $12.48 with lower resistance at $12.40-$12.50 getting recovered. Support is at $12.20-$12.10.
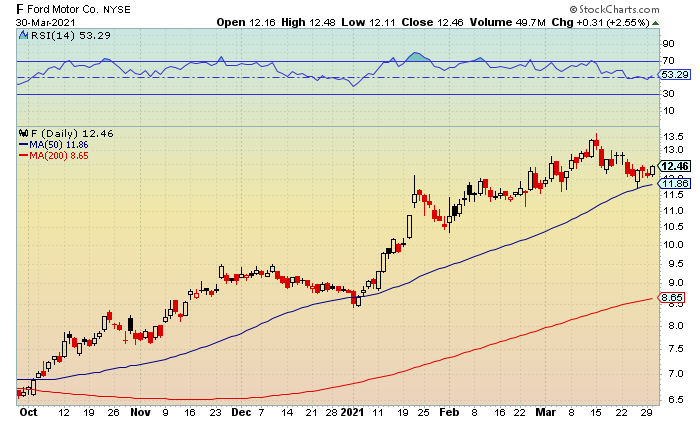
Pre-Market Update for 3/30/2021
Selling Pressure Returns on Hedge Fund Liquidation
8:00am (EST)
The stock market closed mostly lower on Monday following news of the sudden unwinding of positions by a major hedge fund. Specifically, Archegos Capital Management was forced into selling Chinese tech stocks and U.S. media firms on Friday and yesterday that caused some of the nervousness.
Bank stocks slumped after Credit Suisse (CS) warned that they could be hit with sizable losses from the positions that had to be liquidated. The blue-chips managed to escape the selling pressure but volatility jumped 10% and back above a key level of resistance.
The Dow ended at 33,171 (+0.3%) after tapping a fresh all-time high of 33,259. Unchartered territory and lower resistance at 33,250-33,500 was cleared but held. A close above the latter would signal additional momentum towards 33,750-34,000.
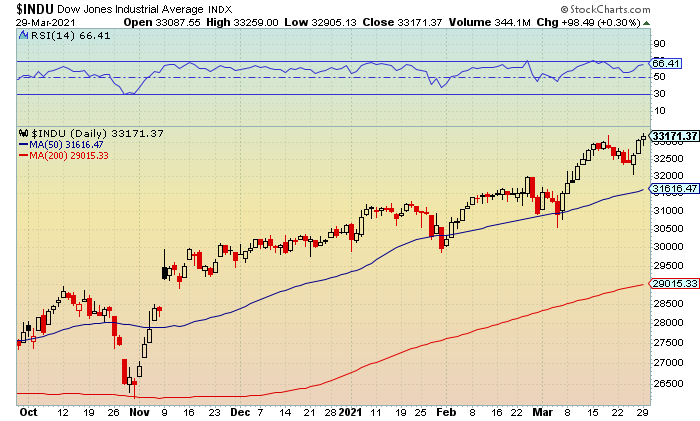
The S&P 500 settled at 3,871 (-0.1%) after trading to a morning low of 3,943. Near-term and upper support at 3,950-3,925 was breached but held. A move below the latter would indicate a further pullback towards 3,900-3,875.
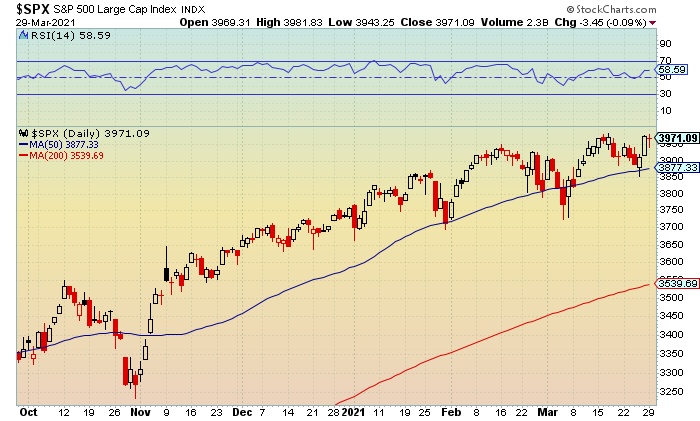
The Nasdaq tagged an intraday low of 12,968 before finishing at 13,059 (-0.6%). Prior and upper support at 13,000-12,850 was tripped but held. A fade below the latter would signal a retest towards 12,750-12,600.
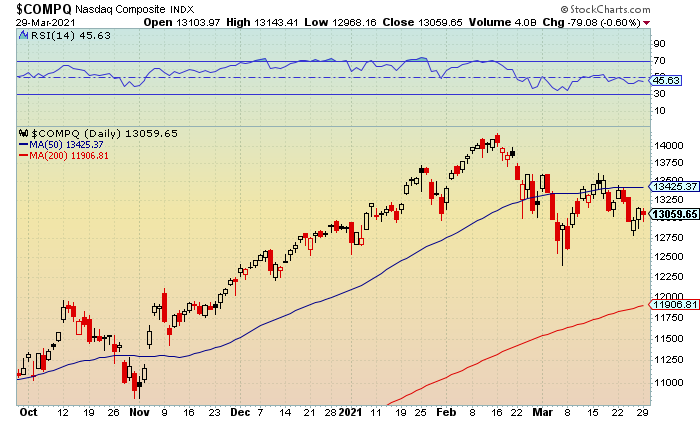
The Russell 2000 closed on its session low of 2,158 (-2.8%) and back below its 50-day moving average. Current and upper support at 2,175-2,150 was tripped and failed to hold. A drop below the latter would signal a retest towards 2,125-2,100 with the early March low at 2,085. Below is a chart of the IWM.
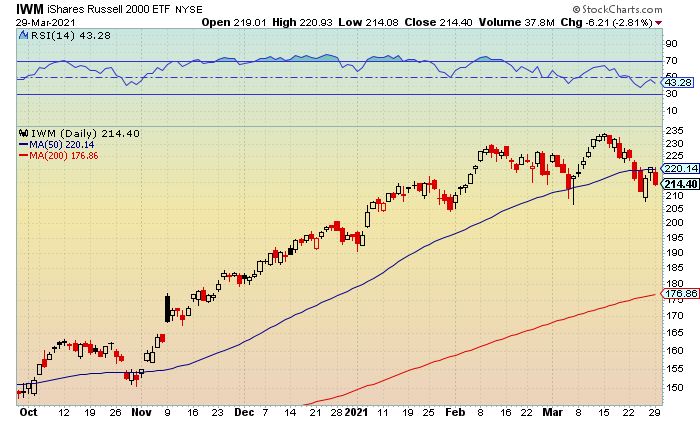
Market Movers
Shares of Houghton Mifflin Harcourt (HMHC) jumped nearly 19% after the company announced an agreement to divest its consumer publishing business, HMH Books & Media, to HarperCollins Publishers, a division of News Corp (NWSA), for $349 million.
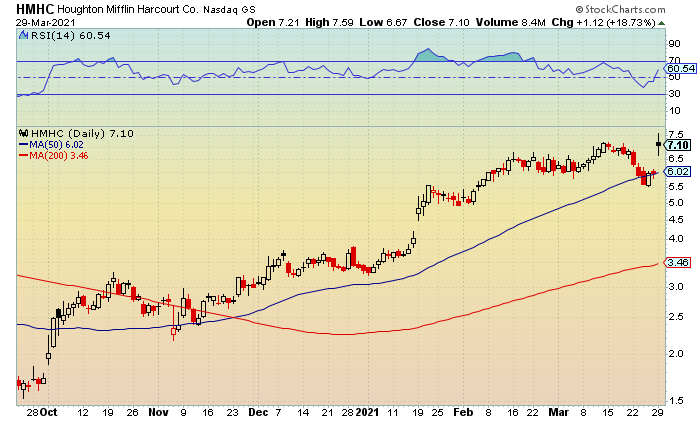
Volatility Index
The iPath S&P Vix Short-Term Futures (NYSEArca: VIX) was up for the first time in three sessions with the intraday high hitting 21.60. Prior and lower resistance at 21.50-22 was cleared but held. A close above the latter would suggest a retest towards 23-23.50 and the 50-day moving average.
Support is at 20-19.50.
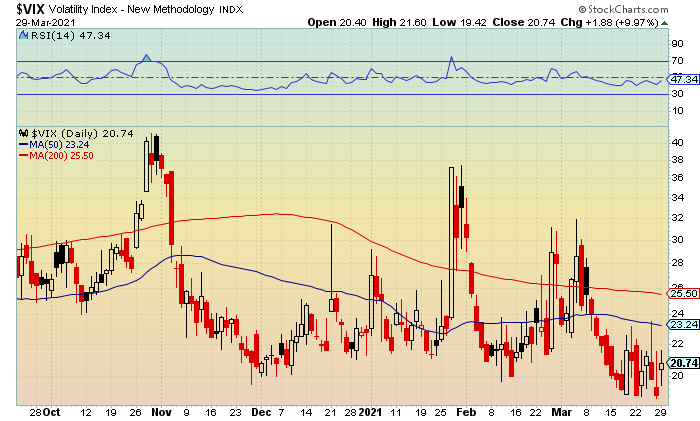
Market Analysis
The iShares Russell Growth 1000 ETF (NYSE: IWF) fell for the fourth time in five sessions with the intraday low kissing $239.13. Current and upper support at $239.50-$239 was tripped but held. A move below the latter would indicate further weakness towards $237.50-$237.
Resistance is at $241.50-$242 followed by $243.50-$244 and the 50-day moving average.
RSI has leveled out with key support at 50 holding. A drop below this level would suggest additional weakness towards 45-40. Resistance is at 55-60.
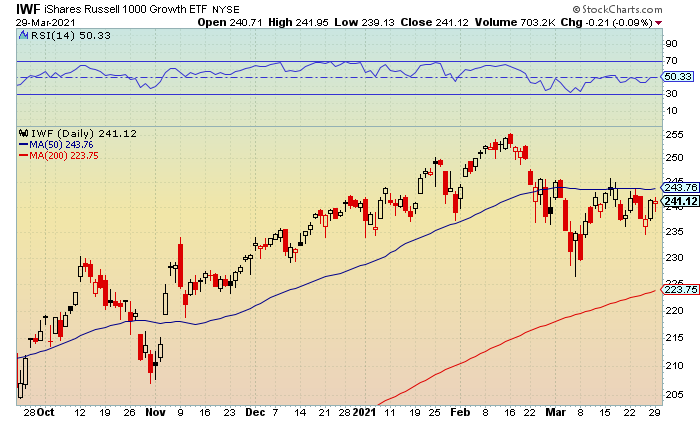
Sector
The Technology Select Sector Spider Fund (NYSE: XLK) pulled back after testing a low of $130.98 and closing back below its 50-day moving average. Current and upper support at $131-$130.50 was breached but held. A move below the latter would signal weakness towards $128.50-$128.
Resistance is at $132.50-$133 followed by $134-$135.
RSI is in a slight downtrend with key support at 50 holding. A close below this level would signal a retest 45-40. Resistance is at 55.
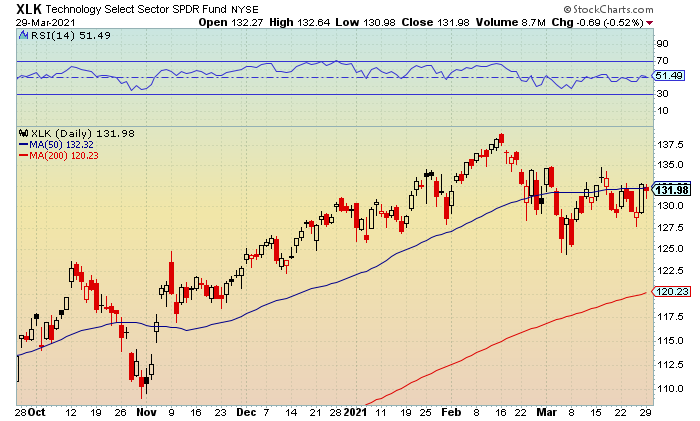
Market Outlook
There are two trading days left before March is in the books and I mentioned there could be some end of month selling pressure. It is also a shortened week with the market closed on Friday ahead of the Easter weekend. However, there will be a key report on employment as Good Friday this year isn’t considered a federal holiday.
It’s a fairly rare occurrence and it is only happened 12 times since 1980, with the last time occurring on 2015. This means traders will have to decide weather to stay long or short ahead of the three-day weekend with heightened volatility likely coming on Monday.
Options Play List
Utz Brands (UTZ, $25.01, up $0.65)
UTZ May 25 calls (UTZ210521C00025000, $1.65, up $0.47)
Entry Price: $1.45 (3/29/2021)
Exit Target: $2.90
Return: 14%
Stop Target: None
Action: Monday’s peak reached $25.31 with prior and lower resistance at $25.25-$25.50 getting cleared but holding. Fresh support is at $25-$24.75 and the 50-day moving average.
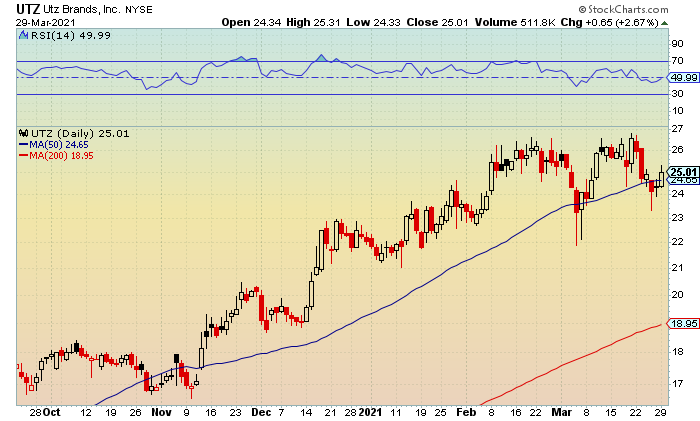
International Game Tech (IGT, $16.04, down $1.38)
IGT April 20 calls (IGT210416C00020000, $0.10, down $0.15)
Entry Price: $0.95 (3/17/2021)
Exit Target: $1.90
Return: -89%
Stop Target: None
Action: Shares closed on the session low of $16.04 with key support at $16 holding. Lowered resistance is at $16.25-$16.50.
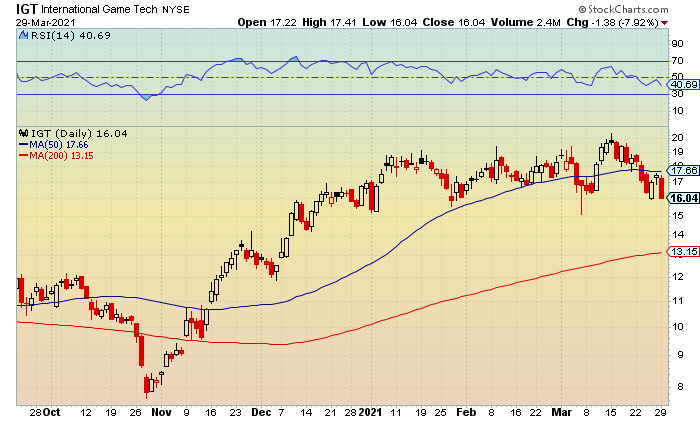
Ford Motor Company (F, $12.15, down $0.15)
F April 14 calls (F210416C00014000, $0.07, down $0.03)
Entry Price: $0.45 (3/8/2021)
Exit Target: $0.90
Return: -84%
Stop Target: None
Action: Yesterday’s low reached $12.06 with upper support at $12.10-$12 getting tripped but holding. Resistance is at $12.30-$12.40.